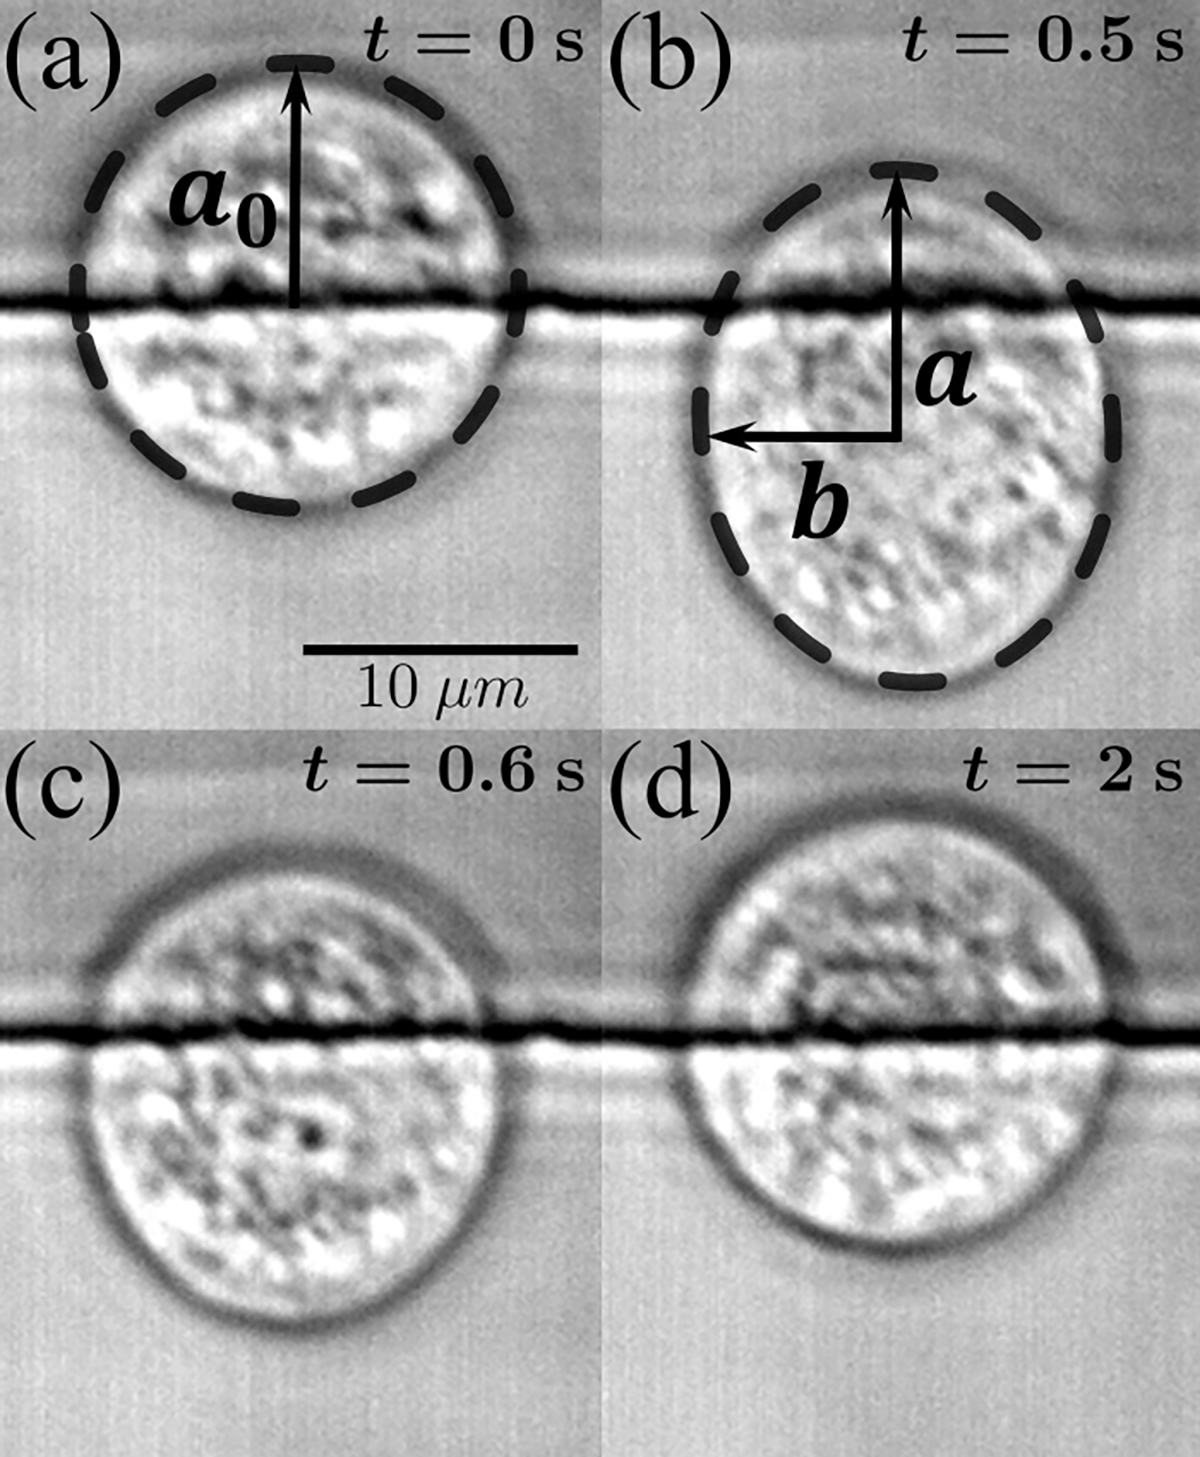
FIG. 2.

Exemplary images of the cell deformation-relaxation process. (a) An MDA-MB-231 cell at rest prior to the deformation pulse ( and ); the horizontal line is one of the electrode edges. (b) The same cell is deformed with a high-amplitude, high-frequency pulse (, and ). Here and denote the long and short axes of the ellipse, respectively. (c) The cell begins to relax once the pulse ceases ( and ). (d) The cell eventually recovers its shape at the end of relaxation ( and ).
