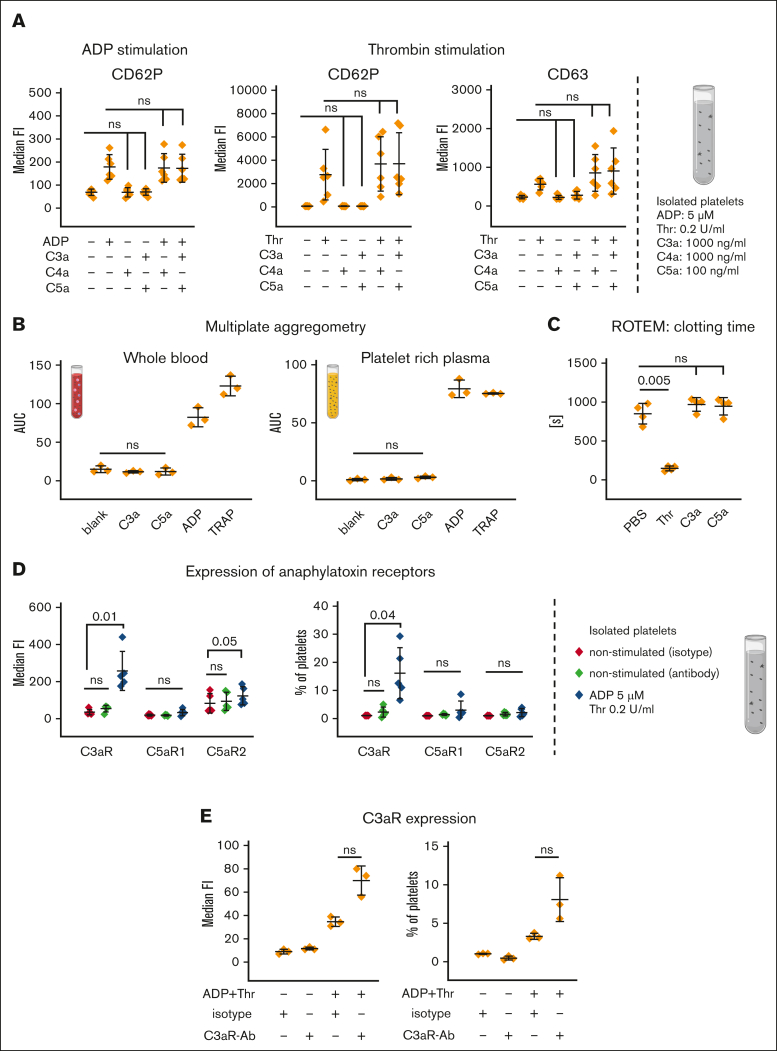
Figure 3.
Influence of anaphylatoxins on platelet activation. (A) Anaphylatoxin stimulation of isolated platelets. Isolated platelets were exposed to either PBS−/− (neg Ctrl), ADP (5 μM), thrombin (Thr, 0.2 U/mL), C3a (1000 ng/mL), C4a (1000 ng/mL), or C5a (100 ng/mL) alone or in combination, as indicated. After stimulation for 10 minutes, cells were analyzed via flow cytometry for surface expression of the activation markers CD62P or CD63. (B) Multiplate aggregometry. Lepirudin-anticoagulated blood or platelet-rich plasma was mixed with NaCl (0.9%, neg. Ctrl), ADP (6.5 μM), TRAP (32 μM), C3a (1.8 μM), or C5a (0.18 μM), 2 minutes before analyzing platelet aggregation. Mean of the area under the curve with standard deviation is shown. (C) ROTEM without the addition of a specific reagent that activates the intrinsic or extrinsic pathway. Immediately before starting the reaction, citrated blood was exposed to Thr (1 U/mL), C3a (1.8 μM), or C5a (0.18 μM) and was recalcified without addition of the extrinsic or intrinsic pathway starting reagents. Mean values with standard deviation of the clotting time are shown. (D) Expression of anaphylatoxin receptors on platelets. Isolated platelets were stimulated with either PBS−/− (neg Ctrl) or ADP (5 μM) and Thr (0.2 U/mL) for 10 minutes before being analyzed for C3aR (final antibody concentration: 2 μg/mL, clone: hC3aRZ8), C5aR1 (final antibody concentration: 1 μg/mL; clone: S5/1), and C5aR2 (final antibody concentration: 4 μg/mL; clone: 1D9-M12) surface expression. Respective isotype controls were included in equimolar concentrations. Mean values with standard deviations are shown. (E) C3aR expression on isolated platelets. As in panel D but with isotype staining after platelet stimulation. At least 3 independent assays are shown in each panel. Data sets were tested for outliers using the ROUT outlier test (Q = 5%). Data sets in panels A [CD62P ADP, CD62P Thr], B-C, and E were analyzed using repeated measures one-way ANOVA and data set in panel A [CD63 Thr]) by Prism mixed-effects model (because of a missing value). Experimental groups were post hoc tested for statistical significance with correction for multiple comparisons (panel A, Sidak; panel B, Dunnet comparison; and panels C,E, Tukey test). The data set in panel D was tested using a repeated measures two-way ANOVA test for adjusted multiple comparisons. For the sake of visibility, nonsignificant P values were omitted from graphs, unless they were of relevance to the experimental hypotheses.

