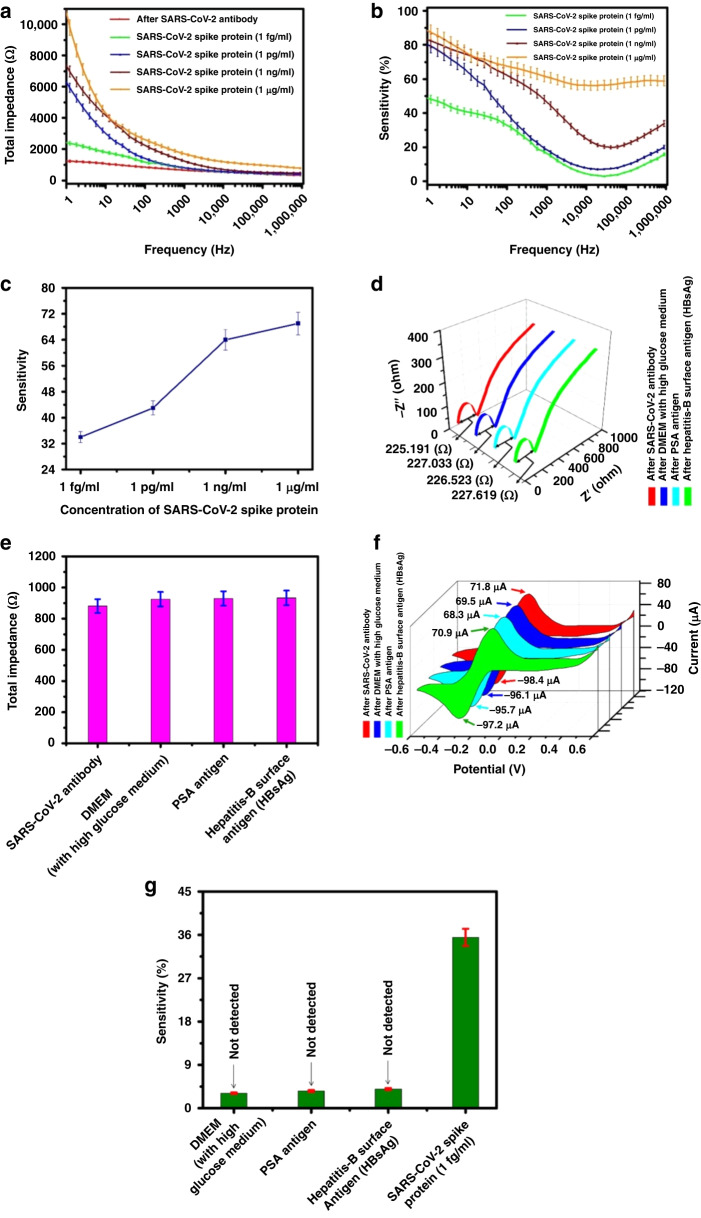
Fig. 6. Sensitivity and selectivity performances of the developed sensor.
a Total impedance variation with different frequency before and after exposure to four increasing concentration of SARS-CoV-2 spike protein (i) SARS-CoV-2 antibody, (ii) 1 fg/ml, (iii) 1 pg/ml, (iv) 1 ng/ml, (v) 1 µg/ml. b The change in average sensitivity characteristics with the frequency of the GCE-based sensor at an applied voltage of 5 mV for the sample containing concentrations of 1 fg/ml to 1 µg/ml SARS-CoV-2 spike protein. c The change in average sensitivity characteristics with varying SARS-CoV-2 spike protein concentrations at a frequency of 100 Hz. d Nyquist impedance plots of GC sensor electrode before and after capturing 1 fg/ml concentration of Hepatitis-B surface antigen, 3 µg/ml concentration of PSA antigen and DMEM with high glucose medium. e Plot column chart of total impedance at a specific frequency of 100 Hz in DMEM (with high glucose medium), concentration of PSA antigen (3 µg/ml), and Hepatitis-B surface antigen (1 fg/ml). f CV plots before and after capturing 1 fg/ml concentration of Hepatitis-B surface antigen, 3 µg/ml concentration of PSA antigen and DMEM with high glucose medium. The measurement was carried out using 10 mM potassium ferrocyanide, K4[Fe(CN)6], in 0.5 M potassium chloride (KCl). g Average sensitivity plots of the proposed sensor at a specific frequency of 100 Hz for 1 fg/ml concentration of Hepatitis-B surface antigen (HBsAg), 3 µg/ml concentration of PSA antigen, DMEM with high glucose medium and 1 fg/ml concentration of SARS-CoV-2 spike protein

