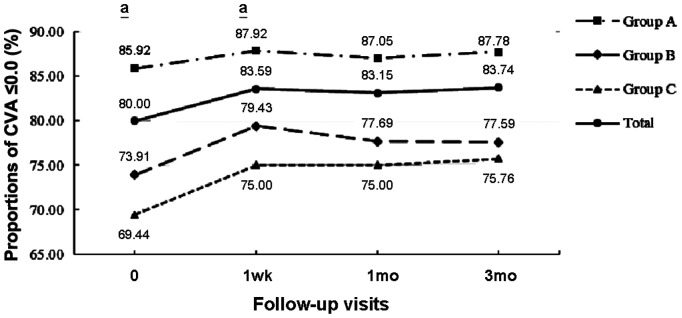
Figure 2. The proportion of visual acuity achieving 0.0 or better in each group at various follow-up visits.
aP<0.05, representing a statistically significant difference among the three groups; X-axis: The proportion of visual acuity achieving 0.0 or better; Y-axis: Various follow-up visits; CVA: Corrected visual acuity with contact lenses; Group A: Cylinder degree range of -0.75 to -0.50 D; Group B: Cylinder degree range of -1.75 to -1.00 D; Group C: Cylinder degree ≤-2.00 D.

