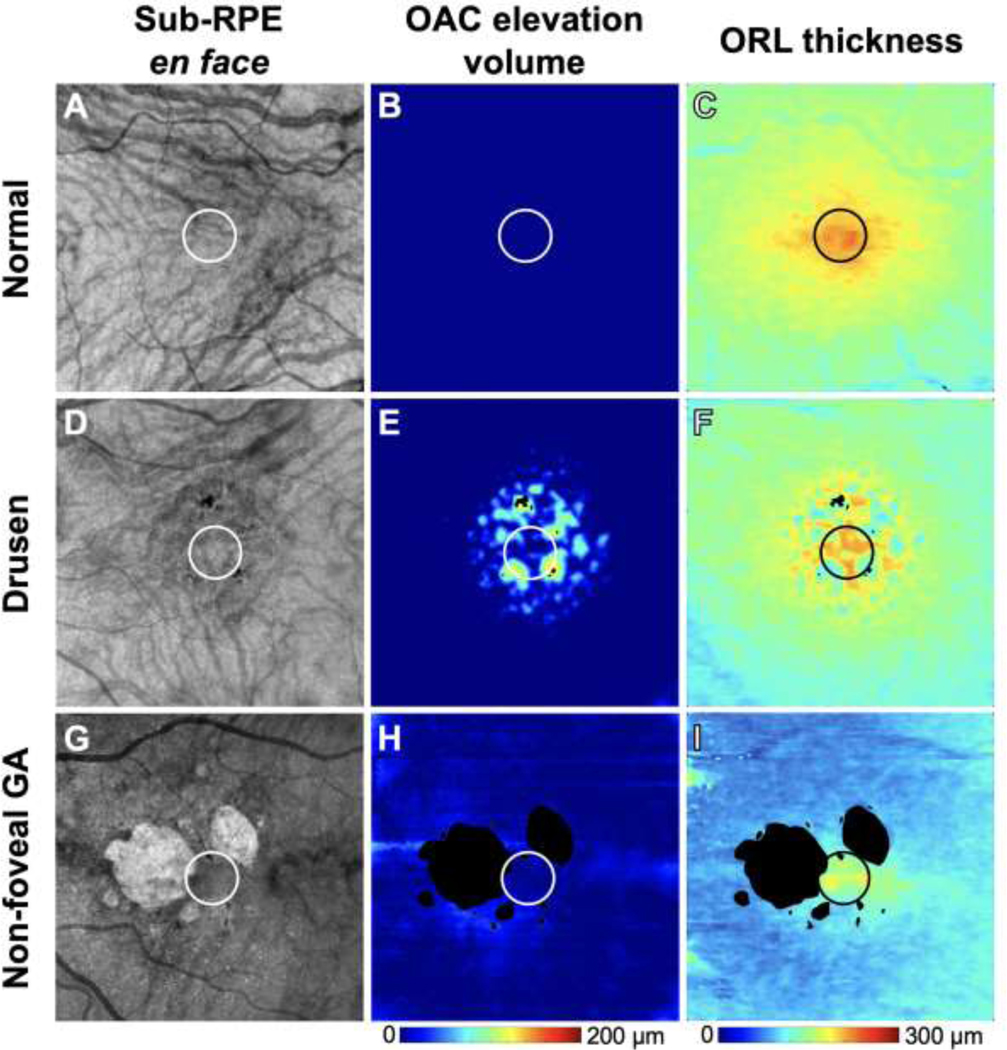
Figure 2:

The same representative examples as in Figure 1 of a normal eye (A-C), a drusen-only eye (D-F) and an eye with non-foveal geographic atrophy (G-I) along with corresponding measurements of optical attenuation coefficient (OAC) elevation volume (B, E, H) and outer retinal layer (ORL) thickness (C, F, I). The 1 mm circle centered on the fovea indicates the area that was used for quantification. Color bars: (B, E, H) OAC elevation volume: 0–200 μm; (C, F, I) ORL thickness: 0–300 μm.
