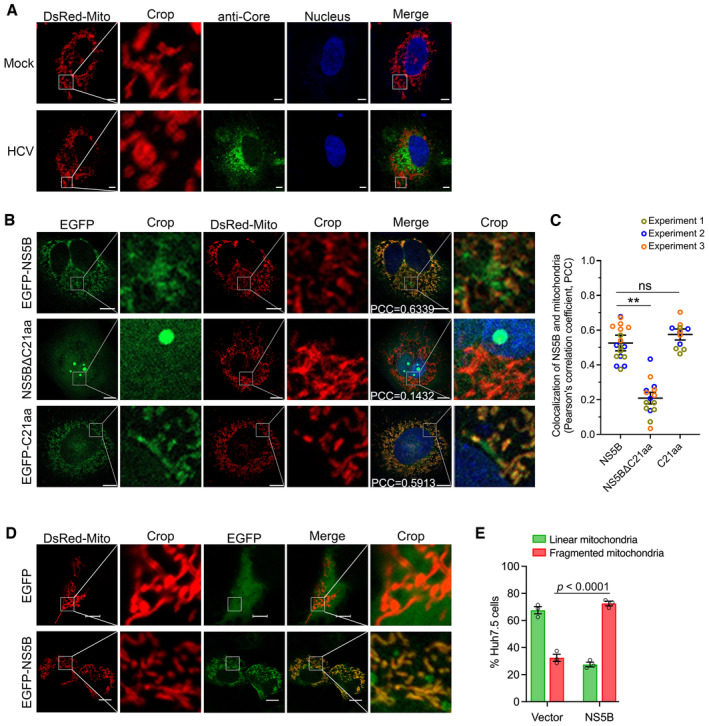
Figure 2. HCV NS5B localized to mitochondria and induced mitochondrial fragmentation in Huh7.5 cells.

- HCV infection induced mitochondrial fragmentation. Huh7.5 cells were infected with HCV 2a JFH1 for 48 h, followed by transfection with DsRed‐Mito‐expressing plasmid. Twenty‐four hours post‐transfection, the cells were fixed and immunostained for HCV Core (green), using mouse primary antibody anti‐Core for 2 h at room temperature, followed by incubation of goat anti‐mouse‐conjugated IgG (H+L) highly cross‐adsorbed secondary antibody Alexa Fluor® 488 conjugate for 1 h at room temperature. Mitochondria were visualized by DsRed‐Mito (red) and nuclei were stained with Hoechst (blue). The images were captured by Zeiss LSM800, and the representative images are shown. Scale bars, 10 μm.
- HCV NS5B localization to mitochondria. Huh7.5 cells were transfected with EGFP‐NS5B, EGFP‐NS5BΔC21aa, or EGFP‐C21aa, alone with DsRed‐Mito plasmid for 48 h. The cells were fixed and images were taken by confocal microscopy. NS5B and mitochondria were visualized by EGFP (green) and DsRed‐Mito (red), respectively. The images were captured using Zeiss LSM800. Nuclei were stained with Hoechst (blue). The Pearson's correlation coefficient (PCC) between NS5B and mitochondria was indicated in the merged images. Scale bars, 10 μm.
- Co‐localization analysis of NS5B and mitochondria. The Huh7.5 cells were transfected with DsRed‐Mito and various version of NS5B. The images were taken by Zeiss LSM800, and the co‐localization of NS5B and mitochondria was analyzed for PCC. The experiment was conducted independently three times, and a total of 18 cell images from NS5B‐transfected cells, 15 cell images from NS5BΔC21aa‐transfected cells, and 12 cell images from C21aa‐transfected cells were analyzed using Imaris 8.4 software. The statistics analysis was conducted using the mean of the three independent experiments and shown as the mean ± SEM; meanwhile, the datapoints representing the cells derived from each experiment are indicated by different colors. One‐way ANOVA with Dunnett's post‐hoc test was used to analyze the difference (comparing to WT cells transfected with NS5B). **P < 0.01; ns, not significant (P > 0.05).
- NS5B induced mitochondrial fragmentation. Huh7.5 cells were transfected with EGFP‐NS5B or vector EGFP‐C1 plasmid, together with DsRed‐Mito, for 48 h. Then, the cells were fixed and processed for confocal microscopy analysis. NS5B was visualized by EGFP signal (green), and mitochondria were visualized by DsRed‐Mito (red). Scale bars, 10 μm.
- The ratio of Huh7.5 cells with linear and fragmented mitochondria was determined in the Huh7.5 cells following transfection of DsRed‐Mito and vector, or DsRed‐Mito and NS5B. Data are presented as mean ± SEM from three independent experiments. A total of 46 cell images from vector‐transfected cells, and 40 cell images from NS5B‐transfected cells were analyzed. Two‐way ANOVA with Tukey's post‐hoc test was used to analyze the difference.
Source data are available online for this figure.
