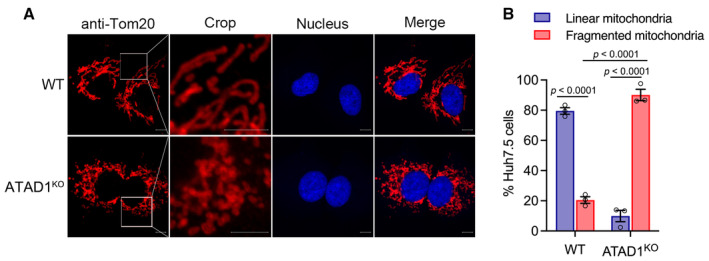
Figure EV3. Knockout of ATAD1 induced mitochondrial fragmentation.

- WT and ATAD1KO cells were seeded in a 12 mm cell‐climbing sheet plated in a six‐well plate for 16 h. The cells were fixed and blotted with rabbit primary antibody anti‐Tom20 for immunostaining of mitochondria (red), followed by goat anti‐rabbit‐conjugated IgG (H+L) highly cross‐adsorbed secondary antibody Alexa Fluor® 555 for 1 h at room temperature. Nuclei were stained using Hoechst (blue). The typical images were captured by Zeiss LSM800. Scale bars, 10 μm.
- The images of a total of 136 ATAD1KO cells and 82 WT cells taken from three experiments were captured by Zeiss LSM800, and mitochondrial morphology was analyzed (fragmented or linear). The percentage of Huh7.5 cells with linear or fragmented mitochondria was calculated and presented. Data are presented as mean ± SEM from three independent experiments. Two‐way ANOVA with Tukey's post‐hoc test was used to analyze the difference.
