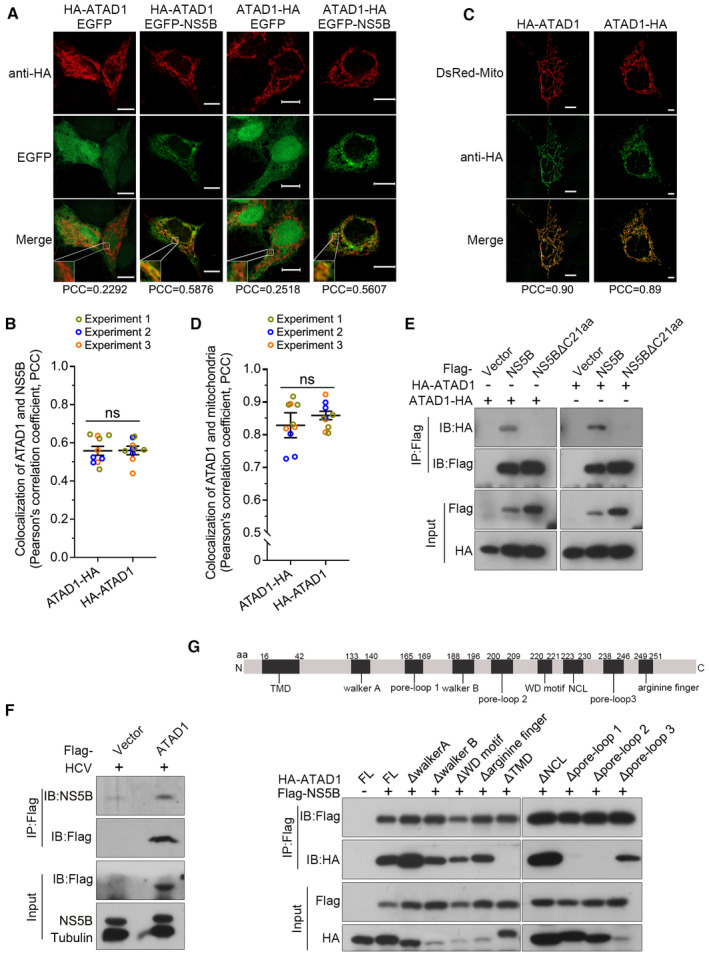
Figure 4. ATAD1 interacted with NS5B protein containing transmembrane domain through its substrate‐binding domains.

- Co‐localization of ATAD1 and NS5B. Huh7.5 cells were co‐transfected with plasmids expressing EGFP‐NS5B and HA‐ATAD1 (HA‐tag at the N‐terminus), EGFP and HA‐ATAD1, EGFP‐NS5B and ATAD1‐HA (HA‐tag at the C‐terminus), or EGFP and ATAD1‐HA, for 36 h. The cells were fixed and blotted with mouse primary antibody anti‐HA for 2 h at room temperature, followed by goat anti‐mouse‐conjugated IgG (H+L) highly cross‐adsorbed secondary antibody Alexa Fluor® 568 for 1 h at room temperature. The images were captured using Zeiss LSM800. Co‐localization of ATAD1 (red) and NS5B (green) was analyzed by analysis of PCC. Scale bars, 10 μm.
- The analysis of PCC of ATAD1 and NS5B. The PCC of NS5B and HA‐ATAD1 as well as NS5B and ATAD1‐HA were analyzed using Imaris 8.4 software. A total of 10 cell images were captured from three experiments. The statistics analysis was conducted using the mean of the three experiments and the results are presented as mean ± SEM; meanwhile, the datapoints representing the cells from each experiment are indicated by different colors. The statistical significance was analyzed using unpaired two‐tailed Student's t‐test. ns, not significant (P > 0.05).
- Localization of ATAD in mitochondria. Huh7.5 cells were co‐transfected with DsRed‐Mito and HA‐ATAD1, or DsRed‐Mito and ATAD1‐HA, for 36 h. The images were captured using Zeiss LSM800, and co‐localization of ATAD1 (green) and mitochondria (red) was analyzed. Scale bars, 10 μm.
- The PCC analysis of ATAD1 and mitochondria. The cells co‐transfected with DsRed‐Mito and HA‐ATAD1 and with DsRed‐Mito and ATAD1‐HA were analyzed using Imaris 8.4 software. A total of 10 cell images obtained from three experiments. The statistics analysis was conducted using the mean of the three experiments and the results are presented as mean ± SEM; meanwhile, the datapoints representing the cells from each experiment are indicated by different colors. The statistical significance was analyzed using unpaired two‐tailed Student's t‐test. ns, not significant (P > 0.05).
- Co‐IP analysis of ATAD1 and NS5B. 293T cells were co‐transfected with plasmids expressing HA‐ATAD1 and Flag‐NS5B, Flag‐NS5BΔC21aa, or the vector plasmid containing Flag‐tag (Flag‐vector), or expressing ATAD1‐HA and Flag‐NS5B, Flag‐NS5BΔC21aa, or Flag‐vector, for 24 h. The cells were harvested and subjected to IP analysis using an anti‐Flag antibody (1:100), followed by western blotting with anti‐HA and anti‐Flag antibodies.
- ATAD1 interacted with endogenous viral NS5B. Huh7.5 cells were infected JFH1 for 24 h, followed by transfection of Flag‐vector or Flag‐ATAD1. The cells were harvested at 48 hpi and subjected to IP analysis using an anti‐Flag antibody (1:100) and western blotting using anti‐Flag and anti‐NS5B antibodies.
- Interaction of NS5B with ATAD1 deletion mutants. Diagram of nine conserved domains in ATAD1 (upper panel) and Co‐IP analysis for ATAD1 deletion mutants with NS5B (lower panel). 293T cells were transfected with plasmids expressing HA‐ATAD1 or ATAD1 domain deletion mutants, together with plasmids expressing Flag‐NS5B or Flag‐vector for 24 h. The cells were harvested and subjected to Co‐IP analysis using an anti‐Flag antibody (1:100) and western blotting using anti‐HA and anti‐Flag antibodies.
Source data are available online for this figure.
