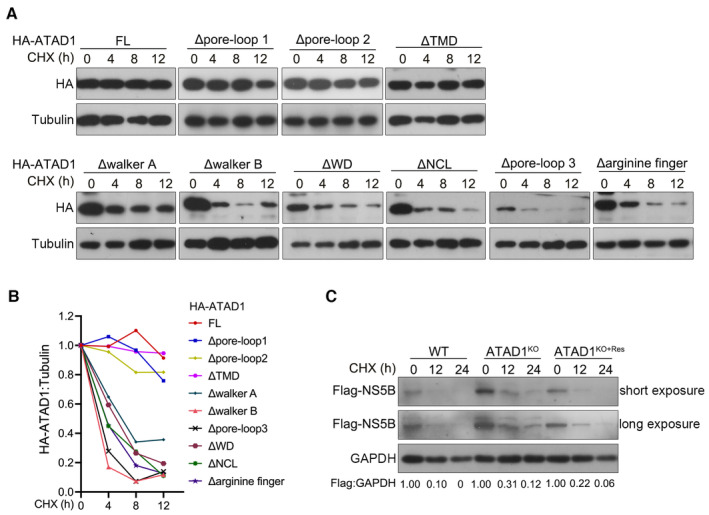
Figure EV4. CHX chase analysis of ATAD1 mutant and NS5B.

- 293T cells were transfected with HA‐ATAD1 or ATAD1 domain‐deletion mutants for 24 h, and then the cells were treated with CHX (100 μg/ml) for indicated time duration. The cells were harvested and analyzed by western blotting with anti‐HA antibody.
- The ratio of HA:tubulin was analyzed by gel band intensities using ImageJ software. The relative levels of HA‐ATAD1 or ATAD1 domain‐deletion mutant proteins at 0 h were normalized to 1.
- WT, ATAD1KO, and ATAD1KO+Res Huh7.5 cells were transfected with Flag‐NS5B for 24 h, and then the cells were treated with CHX (100 μg/ml) for indicated time. The cells were harvested and analyzed by western blotting with anti‐Flag antibody.
