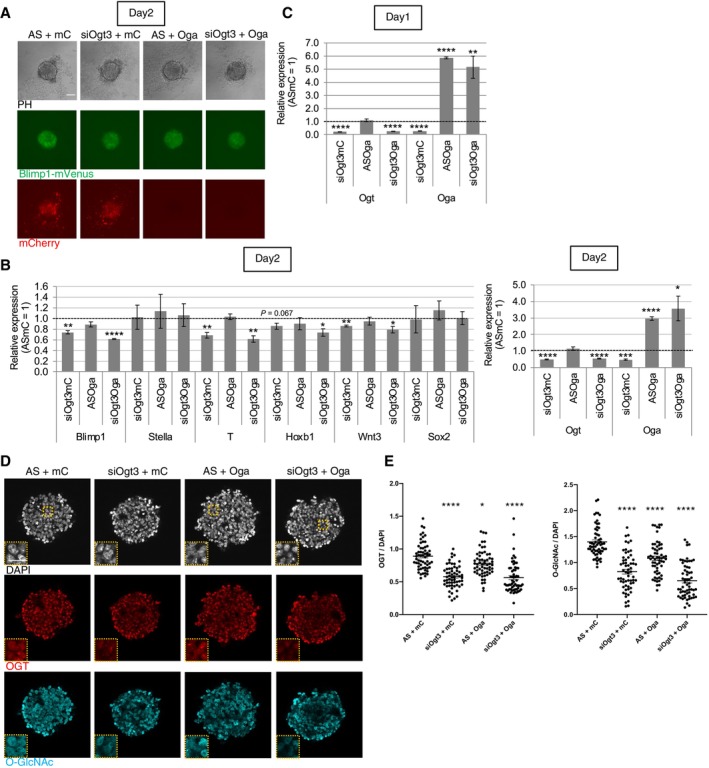
Figure 2. The effects of manipulation of Ogt and Oga gene expression in PGCLC induction.

-
A, BThe effect of Ogt knockdown using siOgt3 and Oga over‐expression using lentiviral vectors on BV fluorescence (A), and gene expression (B) in the PGCLC‐containing aggregates at day 2. AS: AllStars negative control siRNA, mC: mCherry over‐expression vector.
-
COgt knockdown and Oga over‐expression efficiency in the aggregates at day 1.
-
D, EThe effect of Ogt knockdown and Oga over‐expression on the expression of OGT and O‐GlcNAcylation in the PGCLC‐containing aggregates at Day 2 examined by immunostaining (D). Rectangular areas shown in the DAPI images correspond to the enlarged images in the insets. Quantification of relative signal intensities of OGT and O‐GlcNAcylation (E) of each cell in aggregates compared with cells in the AS+mC aggregates (total 60 cells from three biological replicates).
Data information: Values are plotted as mean ± SE of three biological replicates (three technical replicates for each biological replicate sample in B and C). *P < 0.05, **P < 0.01, ***P < 0.001, ****P < 0.0001 (Student's t‐test (B, C) or one‐way ANOVA (E)). P < 0.1 is also indicated by actual values to show difference tendency. Scale bar: 100 μm (A), 50 and 25 μm (insets) (D). See also Fig EV3.
Source data are available online for this figure.
