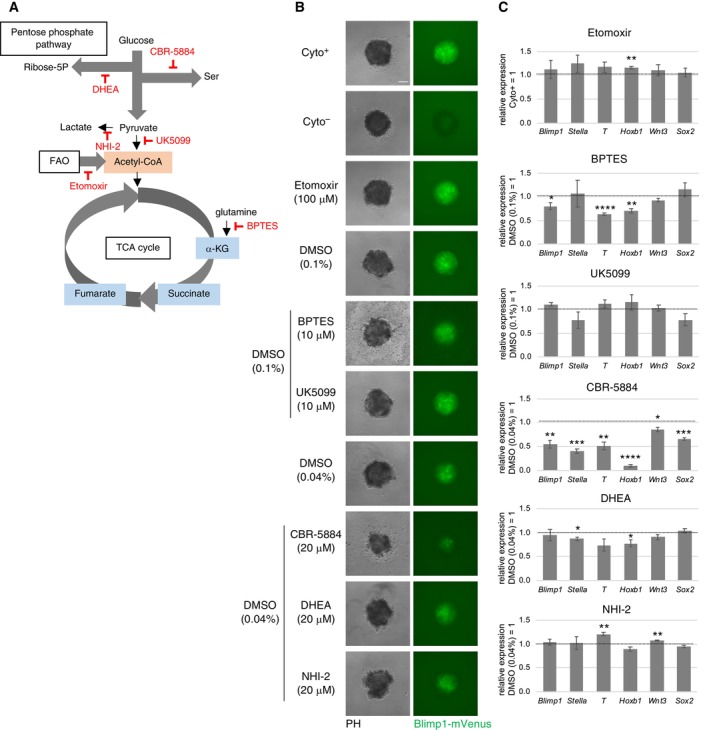
Figure EV2. The effects of inhibition of glycolysis‐related metabolic pathways during PGCLC induction.

-
AA schematic representation of glycolysis‐related metabolic pathways. Inhibitors used in this study are highlighted by red.
-
B, CThe effects of various inhibitors for glycolysis‐related pathways on BV fluorescence (B) and gene expression (C) in the PGCLC‐containing aggregates at Day 2. Scale bar: 100 μm. Values are plotted as mean ± SE of three independent experiments. *P < 0.05, **P < 0.01, ***P < 0.001 (Student's t‐test).
