
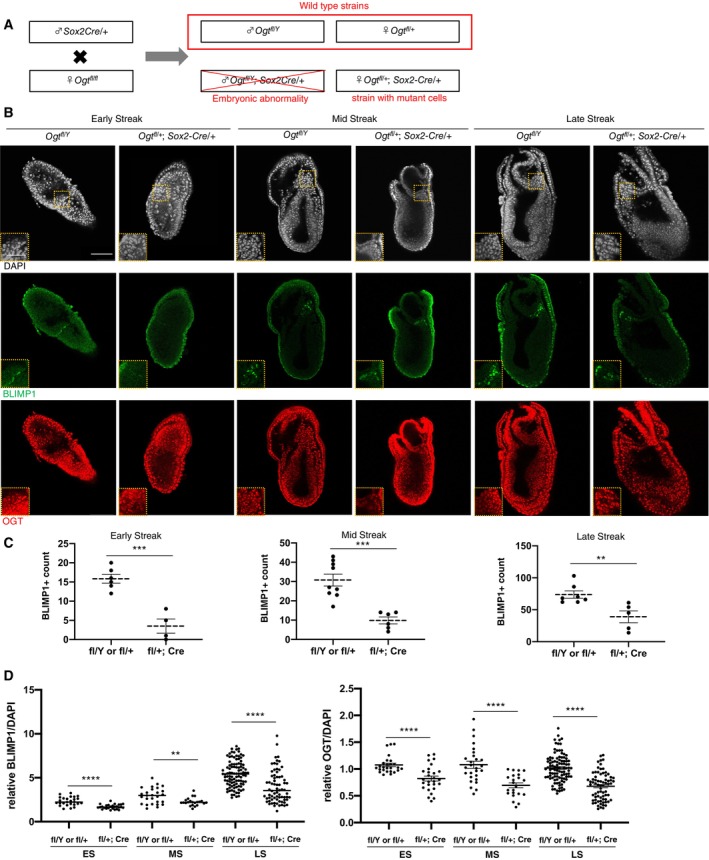
Figure 3. PGC formation in Ogt‐conditional knockout mice.
-
AA scheme of the epiblast specific Ogt knockout mice.
-
BBLIMP1 and OGT immunostaining of embryos of wild type (Ogt fl/Y ) and those with OGT‐deficient cells (Ogt fl/+ ; Sox2Cre) at around E7.0. Rectangular areas shown in the DAPI images correspond to the enlarged images in the insets. Scale bar: 50 and 25 μm (insets).
-
C, DQuantification of the number of BLIMP1‐positive cells (C), relative fluorescent intensities of BLIMP1 and OGT normalized with DAPI signal (D) in PGCs compared to neighboring epiblasts in the embryos with indicated genotypes. ES: early‐streak (wild type (Ogt fl/Y or Ogt fl/+ ), n = 6; mutant (Ogt fl/+ ; Sox2Cre), n = 4); MS: mid‐streak (wild type, n = 9; mutant, n = 6); LS: late streak (wild type, n = 7; mutant, n = 5) in (C). Total 26–101 cells from three biological replicates in (D).
Data information: Values are plotted as mean ± SE. **P < 0.01, ***P < 0.001, ****P < 0.0001 (Student's t‐test). See also Fig EV4.
Source data are available online for this figure.