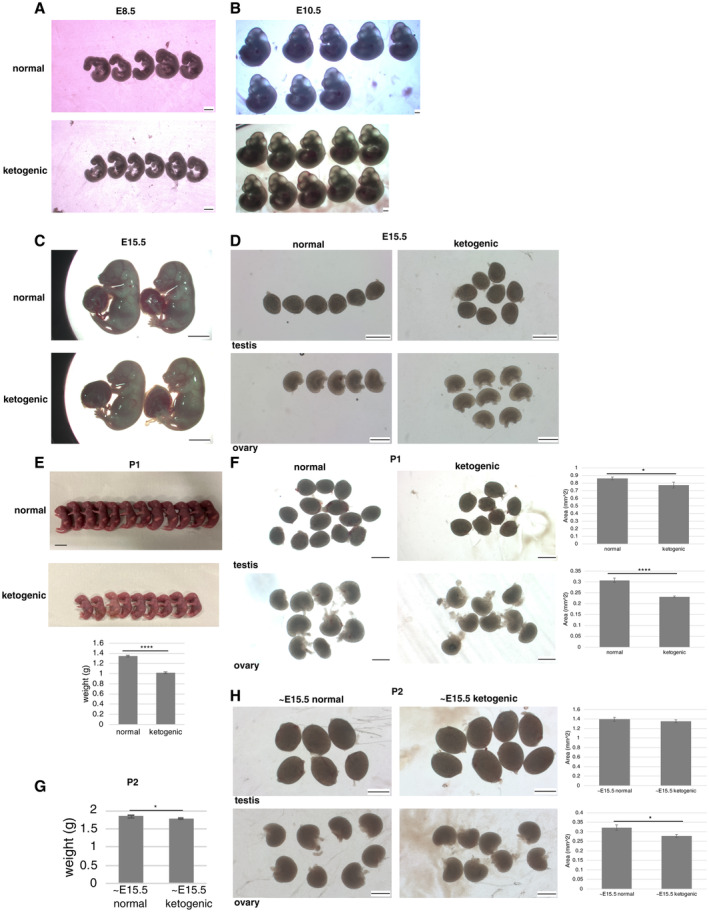
Figure EV5. Embryos and newborn pups from mothers fed a normal or ketogenic diet.

-
A–CE8.5 (A), E10.5 (B), and E15.5 (C) embryos from mothers fed a normal or ketogenic diet.
-
DGonads in E15.5 embryos from mothers fed a normal or ketogenic diet.
-
EP1 pups from mothers fed a normal or ketogenic diet. Weight was measured (normal, n = 25; ketogenic, n = 21).
-
FGonads in P1 pups, testes (normal, n = 14; ketogenic, n = 8), ovaries (normal, n = 9; ketogenic, n = 8). Gonad size was measured as the area value of each gonad quantified in Image J.
-
GWeight of P2 pups from mothers fed a normal or ketogenic diet until E15.5 and normal diet afterwards (normal, n = 12; ketogenic, n = 13).
-
HGonads in P2 pups after switching to a normal diet at E15.5, testes (normal, n = 6; ketogenic, n = 8), ovaries (normal, n = 8; ketogenic, n = 8). Gonad size was measured as the area value of each gonad quantified in ImageJ.
Data information: Values are plotted as mean ± SE. *P < 0.05, **** P < 0.0001 (Student's t‐test). Scale bar: 500 μm (A, B, ovaries in D, F, and H), 5 mm (C), 1 mm (testes in D, F, and H), 1 cm (E).
