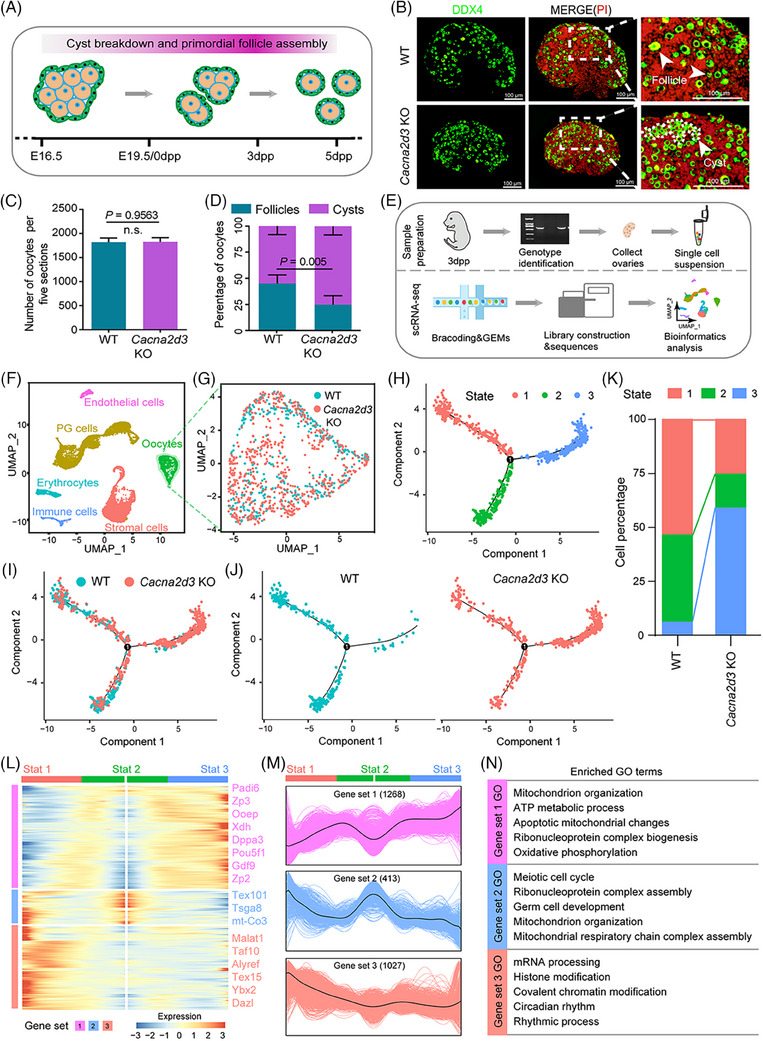
FIGURE 2.

Characterising primordial follicle assembly and transcriptome dynamics of Cacna2d3 KO oocytes from 3 dpp ovaries. (A) Schematic diagram of germ cell cyst breakdown and primordial follicle assembly in function of embryonal (E) and post‐partum (dpp) age. (B) Representative images of germ cell cyst breakdown and primordial follicle assembly in tissue sections of WT and Cacna2d3 KO 3 dpp ovaries; DDX4 positivity identify oocytes (green) in cysts or singly enclosed in PFs while nuclei of all cells were counterstained by propidium iodide (PI, red). Scale bar: 100 μm. (C) Total number of oocytes. Biologically independent repeats. (D) Percentages of oocytes in cysts or within PFs. (E) Schematic diagram of sample preparation for single‐cell RNA sequence (scRNA‐seq). Biologically independent repeats. (F) The six main ovarian cell types identified using UMAP plot. (G) Extraction of oocyte clusters from the UMAP map. (H) Single‐cell pseudotime developmental trajectory of the oocyte populations showing three states and one branching point. (I and J) Pseudotime trajectory of oocytes from both WT and Cacna2d3 KO ovaries. (K) Percentage distribution of the oocytes into the three states. (L) Pseudotime ordered heatmap of three DEGs sets between two obvious fates from State 2 to State 1 or State 3. (M) Graph showing the expression of the three DEGs sets in the pseudotime trajectory. (N) The enrichment of GO terms in gene sets 1, 2 and 3.
