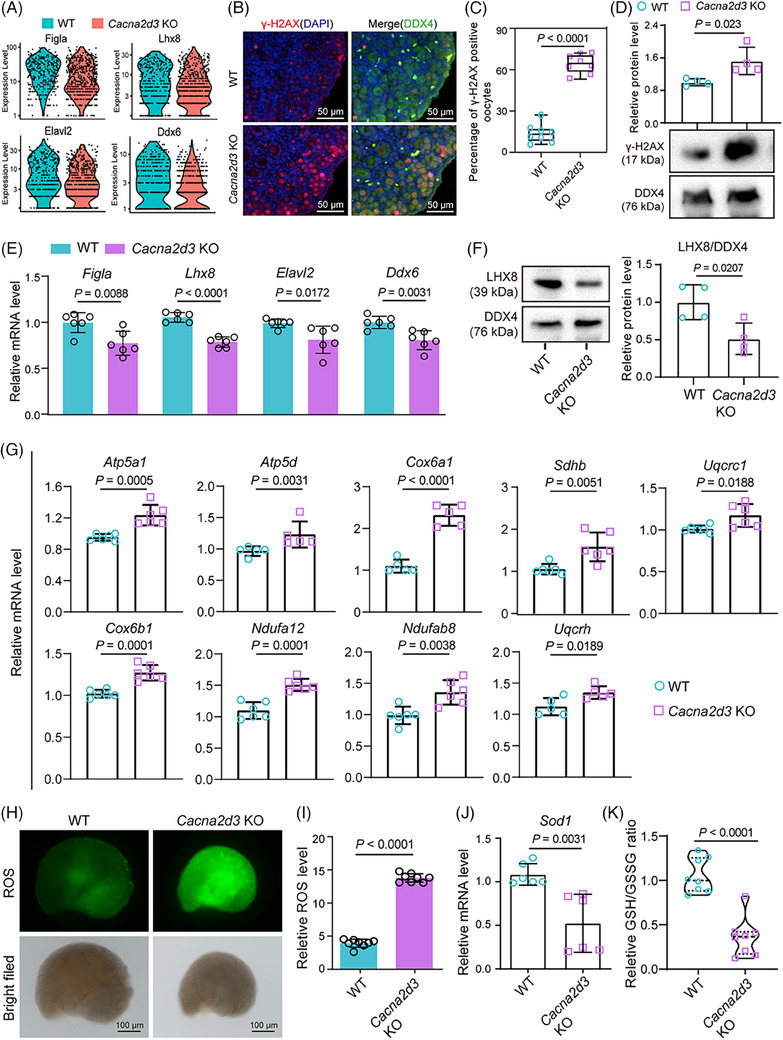
FIGURE 3.

Impact of Cacna2d3 deletion on oocyte‐specific gene expression, DNA damage response and oxidative stress in mouse ovaries. (A) Violin plots of the expression level of oocyte‐specific expression gene in WT and Cacna2d3 KO mice. (B) Representative IF images of γ‐H2AX (red) and DDX4 (green) double staining on tissue sections of WT and Cacna2d3 KO ovaries. Scale bar: 50 μm. (C) Percentage of γ‐H2AX‐positive oocytes in WT and Cacna2d3 KO ovaries. Biologically independent repeats. (D) WB and quantification of γ‐H2AX protein in WT and Cacna2d3 KO ovaries. Biologically independent repeats. (E) RT‐qPCR for Figla, Lhx8, Elavl2 and Ddx6 mRNA performed on tissue samples of the WT and Cacna2d3 KO 3 dpp ovaries. Biologically independent repeats. (F) Representative WB for LHX8 on WT and Cacna2d3 KO ovaries. Biologically independent repeats. (G) RT‐qPCR for mRNA of OXPHOS signalling pathway genes performed on tissue samples of WT and Cacna2d3 KO ovaries. Biologically independent repeats. (H) Representative pictures showing ROS production in WT and Cacna2d3 KO ovaries. Scale bar: 100 μm. (I) Quantification of ROS amount in WT and Cacna2d3 KO ovaries. Biologically independent repeats. (J) RT‐qPCR for Sod1 mRNA performed on tissue samples of WT and Cacna2d3 KO ovaries. Biologically independent repeats. (K) Relative GSH/GSSG ratio in WT and Cacna2d3 KO ovaries. Biologically independent repeats.
