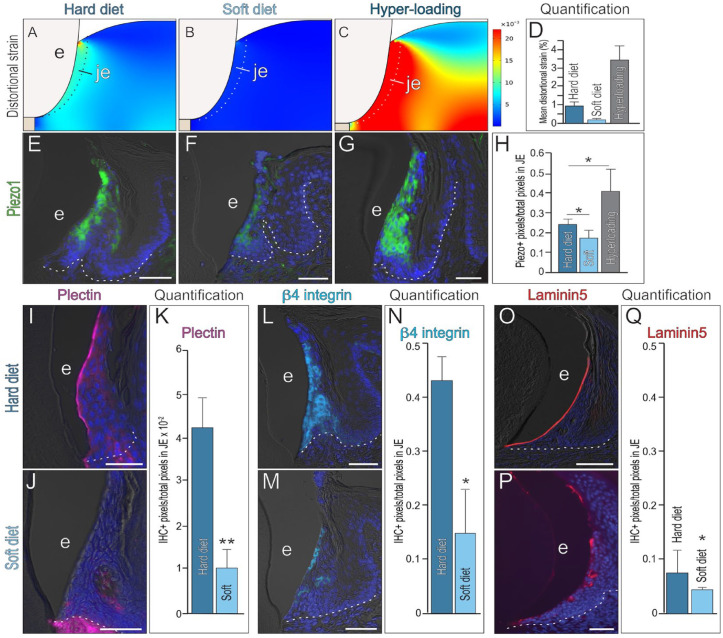
Figure 3.
The junctional epithelium (JE) and its stem cell niche are mechanoresponsive. Distortional strains in the JE produced by masticatory loading associated with (A) a hard diet (B), a soft diet, and (C) hyperloading in combination with a hard diet. (D) Quantification of peak distortional strains in the JE of the 3 loading scenarios. Expression of the mechanosensitive protein Piezo1 in the JE of mice maintained on (E) a hard diet, (F) a soft diet for 4 wk, or (G) a hard diet coupled with hyperloading for 1 d. (H) Quantification of Piezo1+ pixels/total pixels in the JE. One asterisk represents a P value ≤0.05 (n = 3). Representative image of quantitative immunohistochemistry (qIHC) localization of the hemidesmosomal protein Plectin in the JE of the (I) hard diet versus (J) soft diet cohort, quantified in (K). Two asterisks represent a P value ≤0.05 (n = 3). Representative image of qIHC localization of the hemidesmosomal protein β4 integrin in the JE of the (L) hard diet versus (M) soft diet cohort, quantified in (N). One asterisk represents a P value ≤0.05 (n = 3) Representative image of qIHC localization of the hemidesmosomal protein Laminin5 in the JE of the (O) hard diet versus (P) soft diet cohort, quantified in (Q). One asterisk represents a P value ≤0.05 (n = 3) Abbreviations as indicated in Figure 1; scale bars: 50 µm. White dotted lines indicate the boundary between epithelium and underlying connective tissue.

