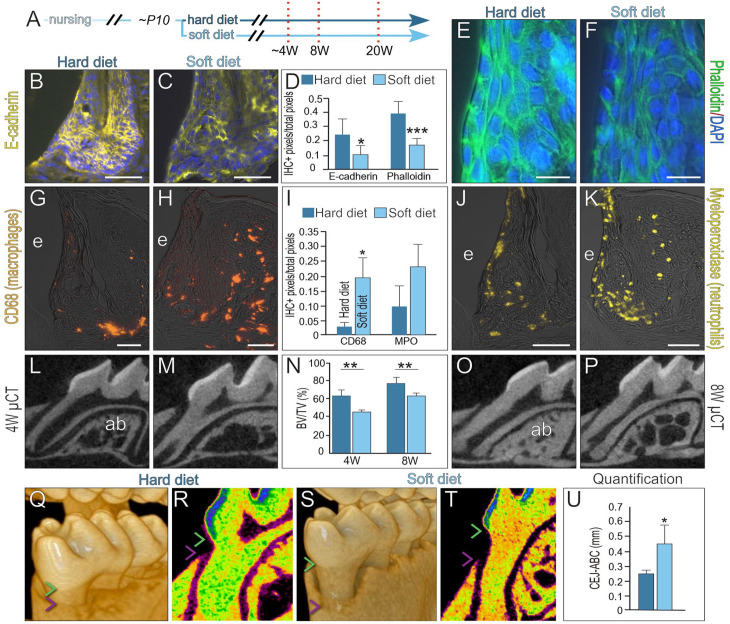
Figure 4.
Compromised junctional epithelium (JE) barrier functions are associated with mild inflammation and alveolar bone loss. (A) Schematic of experimental design, where prior to weaning at P10, mice were provided either a hard or a soft diet. The JE was analyzed after 4, 8, and 20 wk. Representative image of immunohistochemistry (IHC) localization of E-cadherin in the (B) hard and (C) soft diet groups. (D) Quantification of E-cadherin and phalloidin staining. One asterisk represents a P value ≤0.05, and 3 asterisks indicate a P value ≤0.001. Representative image of phalloidin staining in the (E) hard and (F) soft diet groups. After 8 wk on a hard or soft diet, representative image of IHC localization of the macrophage marker CD68 in the (G) hard and (H) soft diet groups, quantified in (I). One asterisk represents a P value ≤0.05 (n = 4). Quantitative IHC localization of the neutrophil marker myeloperoxidase in the (J) hard and (K) soft diet groups. Two-dimensional micro–computed tomography (µCT) imaging of the alveolar bone around the first molar after 4 wk on a (L) hard versus (M) soft diet. (N) Quantification of bone volume/total volume in alveolar bone. Two asterisks indicate a P value ≤0.01 (n = 4). Two-dimensional µCT imaging of alveolar bone around the first molar after 8 wk on a (O) hard versus (P) soft diet. After 20 wk, volumetric µCT imaging was used to measure the distance between the cementoenamel junction (CEJ; green arrowhead) and the alveolar bone crest (ABC; purple arrowhead) in the (Q) hard diet versus (S) soft diet groups. (R, T) Relative density color-mapping of the CEJ and ABC indicated on a representative 2-dimensional µCT density scan and (U) quantification. One asterisk represents a P value ≤0.05. Abbreviations as indicated in Figure 1, and ab, alveolar bone. Scale bars: 50 µm.

