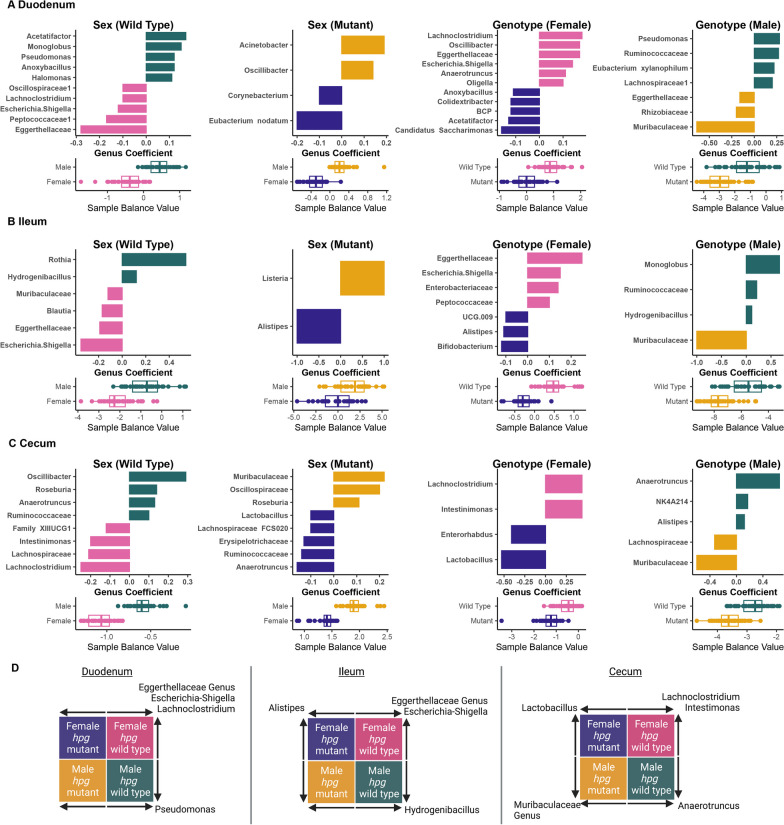
Fig. 6.
Genus-level bacterial balances define intestinal community differences by sex and genotype. Genus-level microbial balances defining wild-type sex differences, mutant sex differences, female hpg genotype differences, and male hpg genotype differences are shown for A duodenum, B ileum, and C cecum. For each balance, coefficients of genera contributing to the balance are shown with bar graphs. The length of the bar (Genus Coefficient) indicates the proportion that each genus contributed to the balance; genera contributing an absolute balance of at least 0.05 are shown. The direction of the bar indicates whether the genus contributed positively or negatively to the balance, and indicates in which group (male, female, mutant or wild-type) the genus was more abundant. Balance values for each sample in the specified groups are shown below each coefficient graph. For instance, in A, Acetatifactor contributed positively to the balance, indicating Acetatifactor had a higher relative abundance in male than female wild-type samples. D Schematic showing genera with a coefficient of at least 0.05 that contributed to both sex and genotype differences, with the arrow indicating the group in which the genus was relatively more abundant within each balance. BCP: Burkholderia/Caballeronia/Paraburkholderia genus group

