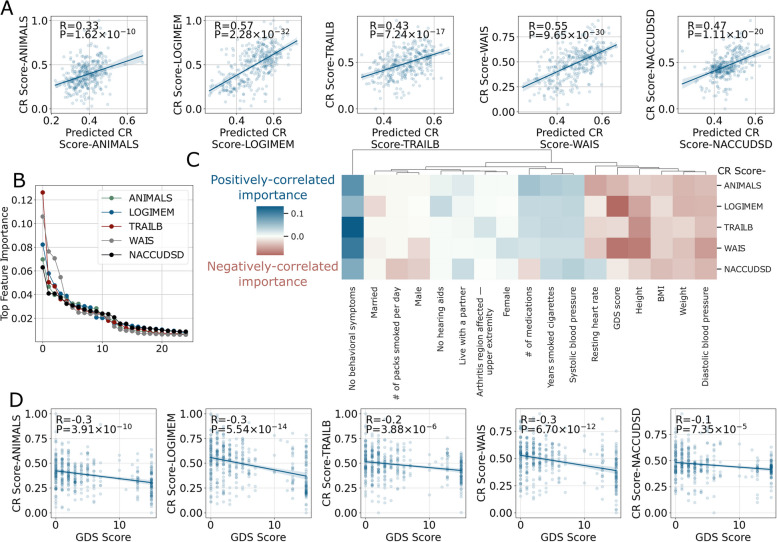
Fig. 4.
ML prediction of CR values using demographic and medical features and model interpretation results. A The performance (Pearson’s R and P value) of the model in predicting CR values based on data collected during life (not including cognitive diagnosis) scores plotted against CR scores estimated using brain autopsy data. B The ranking of feature importance from the random forest model indicated around the top 10 features was the most critical. C A heatmap showing the top 10 most important features aggregated from all five cognitive assessments. Negative signs were assigned to feature importance that was negatively correlated with the predicted CR value. D Geriatric depression scale (GDS) is shown as an example of an important feature for each of the five cognitive assessments

