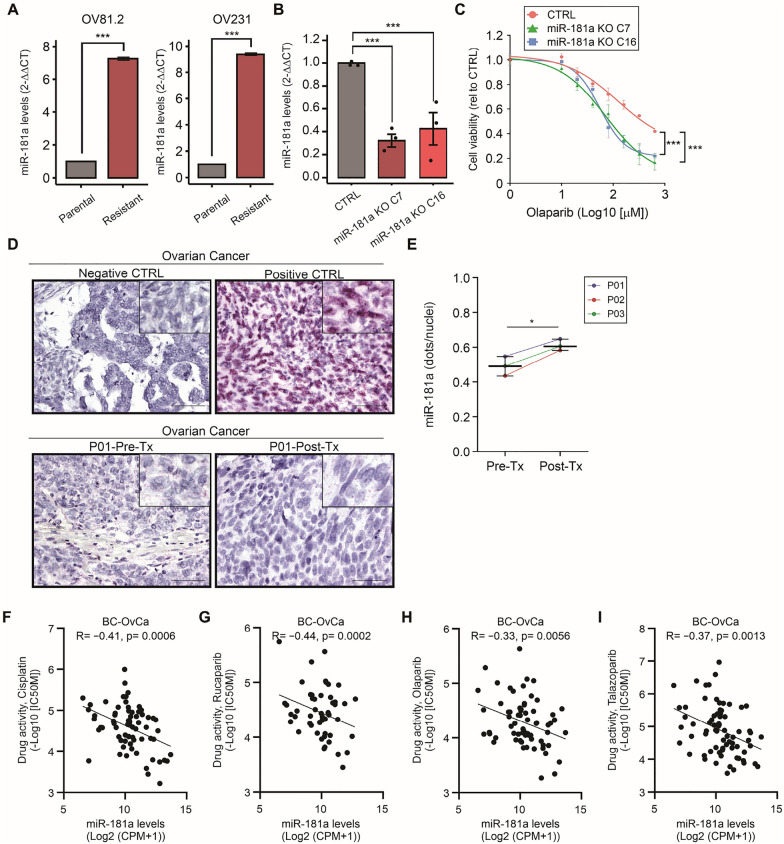
Fig. 7.
High miR-181a levels in OvCa FFPE tissues are associated with olaparib resistance. A Quantification of miR-181a levels by RT-qPCR comparing parental and cisplatin- and olaparib-resistant (Resistant) OV81.2 and OV231 cell lines (Student’s t-test). B Quantification of miR-181a levels by RT-qPCR comparing control Clone 1 (CTRL), miR-181a KO Clone 7 (C7), and miR-181a KO Clone 16 (C16) cell lines (One-way ANOVA). C Drug sensitivity assays comparing control Clone 1, miR-181a KO C7, and miR-181a KO C16 cell lines treated with different concentrations of olaparib (One-way ANOVA and Sidak’s multiple comparisons test). *p < 0.05, **p < 0.01, ***p < 0.001. D Representative images of miR-181a ISH in pre-treatment (Pre-Tx) and post-treatment (Post-Tx) paired tissues from OvCa patients. Images of negative control probes (Negative CTRL), positive control probes (Positive CTRL), Pre-Tx, and Post-Tx paired FFPE tissues from OvCa patient #1 (P01). E Quantification of miR-181a levels (dots/nuclei) in Pre-Tx and Post-Tx paired tissues from OvCa patients (Student’s t-test). *p < 0.05, **p < 0.01, ***p < 0.001. Cell viability assays were performed in triplicates. F–I Correlation between miR-181a levels and cisplatin (F), rucaparib (G), olaparib (H), talazoparib (I) drug activity in the BC and OvCa cell lines obtained from CCLE and GDSC BRCA datasets (Pearson’s correlation coefficient)

