Figure 6.
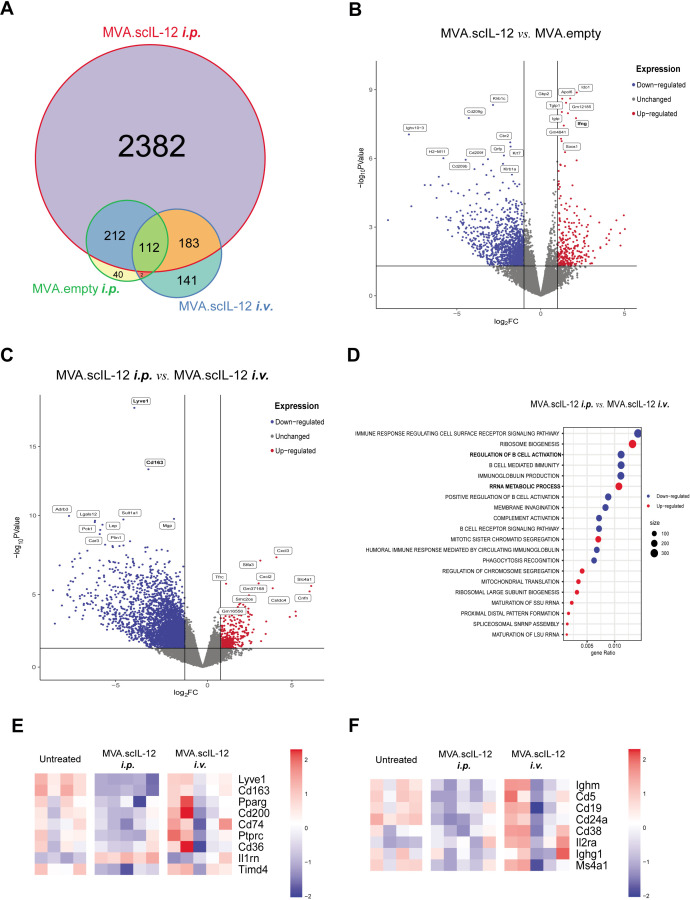
Modulation of the immune response in the omentum after locoregional administration of MVA.scIL-12 by RNA-seq analysis. (A) Venn diagram comparing differentially expressed genes (p value<0.05% and false discovery rate (FDR)<0.05%) in the different experimental groups described in figure 4C. (B) Volcano plots of differentially expressed genes of mice treated with MVA.scIL-12 i.p. versus MVA.empty-treated tumors. Red and blue dots indicate upregulated or downregulated genes, respectively, with a FDR<0.05. (C) Volcano plots of differentially expressed genes of MVA.scIL-12 i.p.-treated mice versus MVA.scIL-12 i.v.-treated tumors. Red and blue dots indicate upregulated or downregulated genes, respectively, with a FDR<0.05. (D) Gene Set Enrichment Analysis showing top 10 upregulated and downregulated GO:BP terms (p value adjusted<0.05%) (F) Heatmap of macrophage-related genes. (G) Heatmap of B-cell-related genes. i.p., intraperitoneal; i.v., intravenous; MVA, modified vaccinia virus Ankara; MVA.scIL-12, MVA encoding scIL-12; RNA-seq, RNA sequencing; scIL-12, single-chain interleukin 12.

