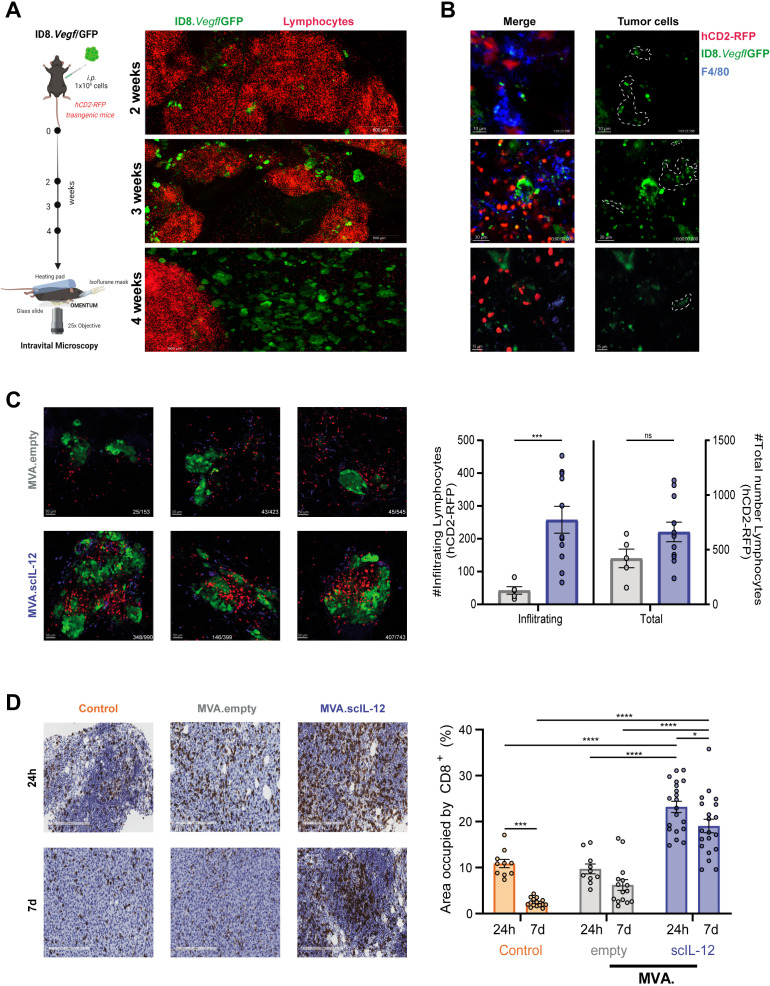
Figure 7.
Intravital imaging and immunohistochemistry of tumor and immune cells in the omentum under treatment with intraperitoneal MVA.scIL-12. (A) Schematic representation of the model. Briefly, transgenic hCD2-RFP mice were challenged with 1×10⁶ ID8.Vegf/GFP tumor cells and omentum was studied by intravital microscopy over time. Representative microphotographs of fluorescent green tumor cells and RFP+ T cells within omenta at 2, 3 and 4 weeks after tumor implantation. (B) Representative microphotographs of macrophages F4/80+ (Alexa Fluor 647, blue) bearing tumor material (GFP+) 15 days after tumor inoculation (C) Representative microphotographs and quantification of T cells (RFP+) infiltrating tumor lesion (GFP+) 48 hours after MVA.empty or MVA.scIL-12 administration to 2 week tumor-bearing mice. Data are represented as mean±SEM. Mann-Whitney U tests. ***p<0.001. (D) Representative microphotographs and quantification of CD8+ T cells infiltrating tumor lesion 24 hours and 7 days after PBS (control), MVA.empty or MVA.scIL-12 administration to 1 week MC38 tumor-bearing mice. Each dot represents a different zoomed area (20×) from three different mice. Data are represented as mean±SEM. Two-way ANOVA was performed followed by Sidak’s post-test. *p<0.05; ***p<0.001; ****p<0.0001. ANOVA, analysis of variance; MVA, modified vaccinia virus Ankara; MVA.scIL-12, MVA encoding scIL-12; PBS, phosphate-buffered saline; scIL-12, single-chain interleukin 12.

