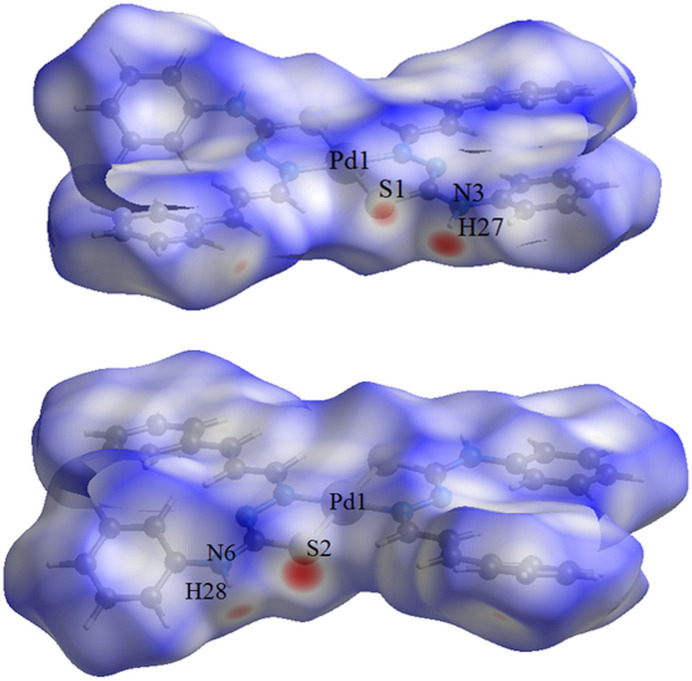
Figure 4.
Two side-views in separate figures of the Hirshfeld surface graphical representation (d norm) for the title compound. The surface is drawn with transparency and simplified for clarity and the regions with strongest intermolecular interactions are shown in magenta. [d norm range: −0.289 to 1.415]

