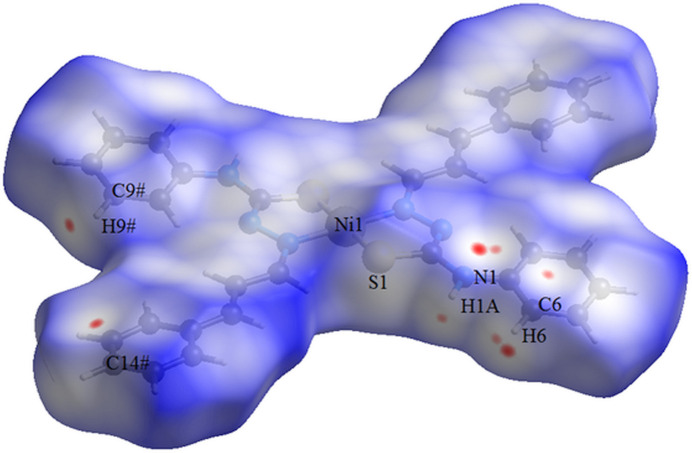
Figure 7.
The Hirshfeld surface graphical representation [d norm range: −0.045 to 1.492] for the centrosymmetric NiII complex (Song et al., 2014 ▸). The surface is drawn with transparency and simplified for clarity. The surface regions with strongest intermolecular contacts are shown in magenta. [Symmetry code: (#) −x + 1, -y+2, −z + 1.]

