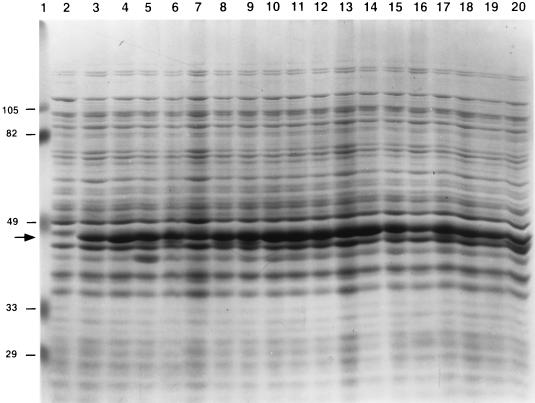
FIG. 3.
SDS-polyacrylamide gel analysis of mutant MBP-pediocin AcH chimeric protein synthesis levels. Proteins were visualized by staining with Coomassie brilliant blue dye. The arrow marks the position of migration of the MBP-pediocin AcH chimeric proteins. Equivalent masses of total culture proteins were analyzed in each lane. Lanes: 1, prestained standards; 2, E609L; 3, E609L/pPR6821; 4, E609L/pKN1; 5, E609L/pNK5; 6, E609L/pCR9; 7, E609L/pKE11; 8, E609L/pCS14; 9, E609L/pCY14; 10, E609L/pWR18; 11, E609L/pIT26; 12, E609L/pMT31; 13, E609L/pAD34; 14, E609L/pGE37; 15, E609L/pGR37; 16, E609L/pNK41; 17, E609L/pHL42; 18, E609L/pKE43; 19, E609L/pKN43; 20, E609L/pCW44. Molecular weights (in thousands) of prestained standards are shown at the left. The levels of synthesis of chimeric proteins varied by about twofold among the strains.

