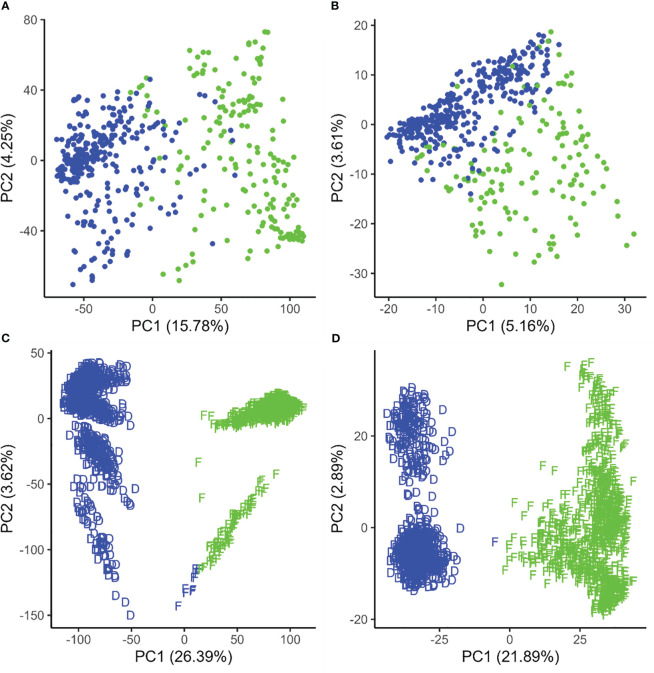
Figure 1.
Population structure displayed by the first two principal components of the genetic distance in canola (A, B) and maize (C, D) based on standard single-nucleotide polymorphisms (A, C) and failed allele calls (B, D). The colors (red and blue) represent clusters based on k-means clustering, while the D and F shapes in maize represent true Dent and Flint clusters.

