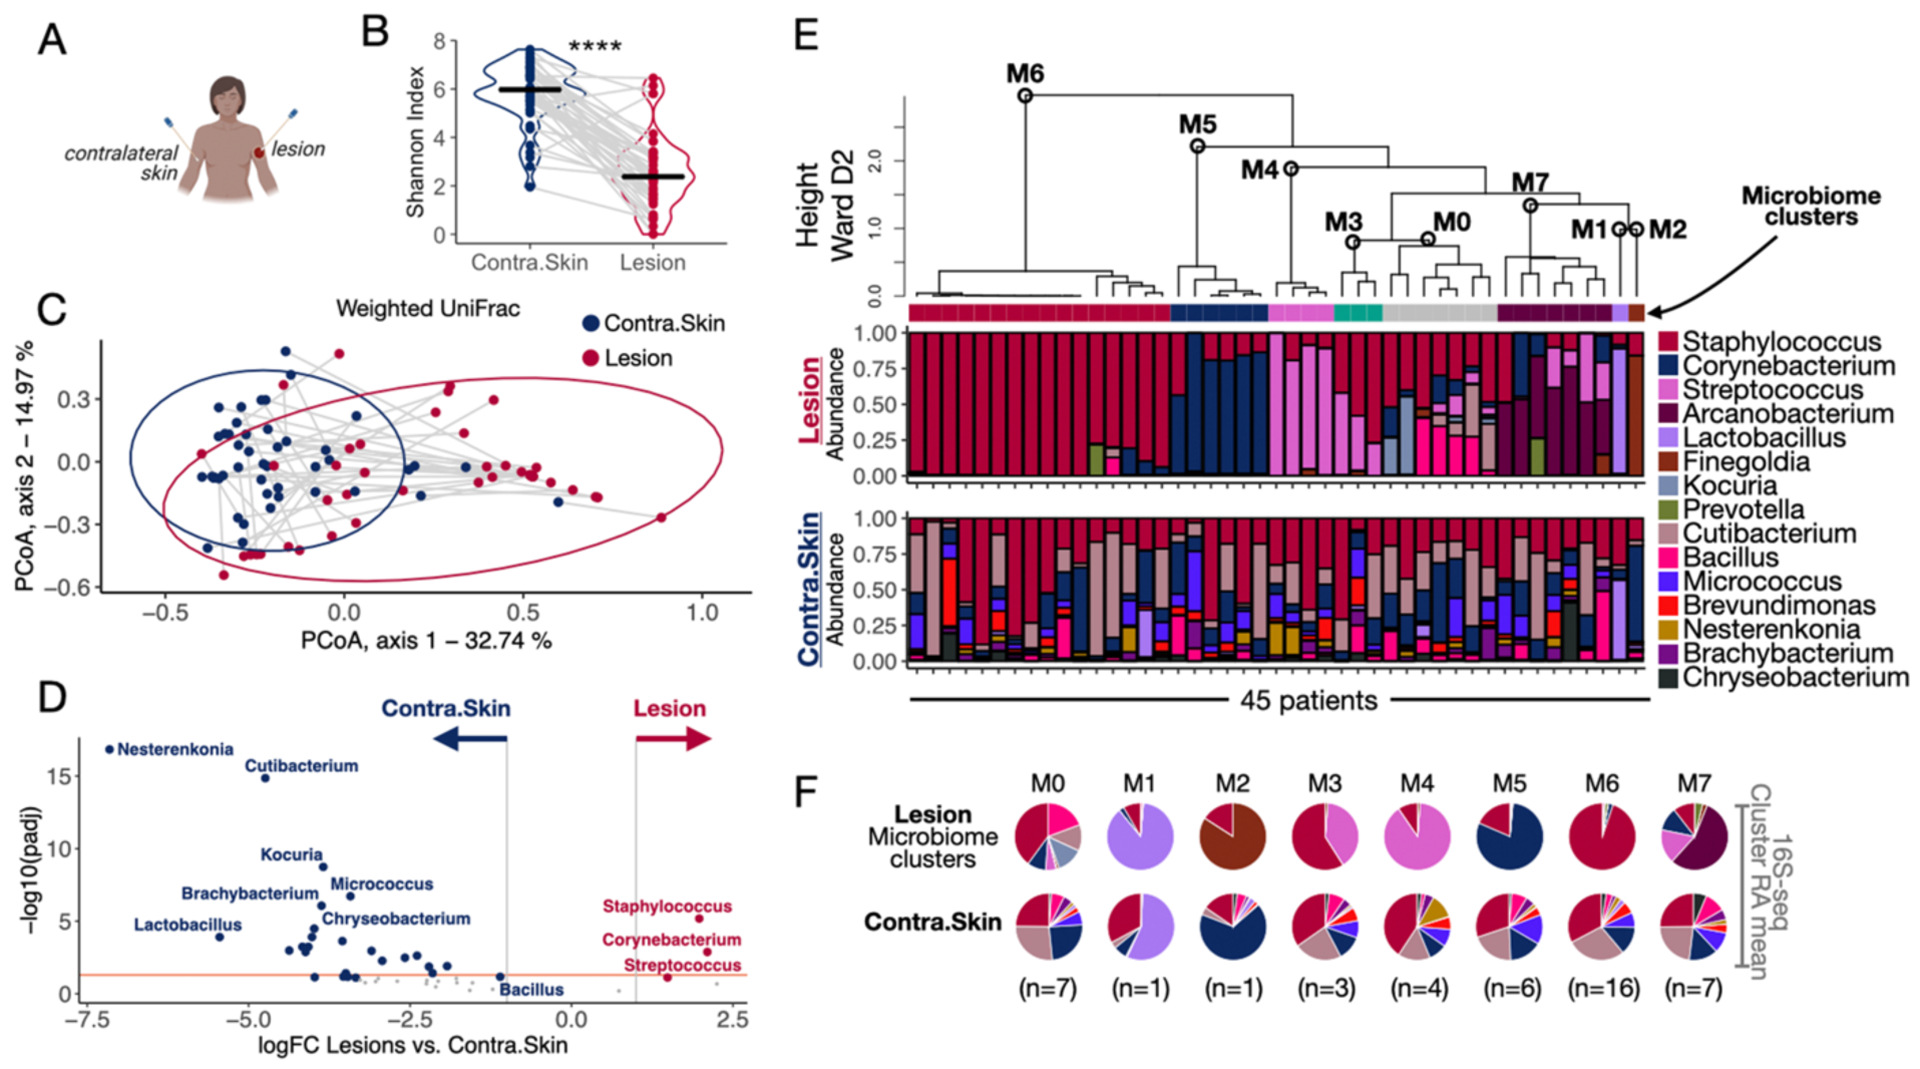
Fig. 2. L. braziliensis infected lesions present distinct microbiome profiles.

A) Swabs were collected from the lesion and contralateral skin sites for 16S-seq analysis. B) Shannon Index assessed bacterial alpha diversity. Gray lines connect the lesion and contralateral skin samples collected from the same patient. Paired t-test was used to calculate the statistical significance, ****P<0.0001. C) Principal coordinate analysis (PCoA) performed on the weighted UniFrac dissimilarity metrics (method to compare the composition between communities) showing lesion and contralateral skin microbiome profiles placed in coordinates 1 and 2. D) Differential taxa abundance analysis between all the lesion and contralateral skin samples collected on Day 0. The orange line indicates adj. P. value = 0.05. E) Unsupervised HC calculated with Ward D2 agglomeration method clustered the lesion samples collected at Day 0 by their top 10 genera microbiome profiles (clusters M0-M7). The relative abundances of the top 10 taxa in the lesions are represented as stacked bar plots (top). The relative abundances associated with the microbiomes in the contralateral skin are represented right underneath the lesion sample from the same patient (bottom). F) The RAmeans of each taxon in lesions and contralateral skin samples per microbiome cluster (M0-M7) was calculated and visualized as a pie chart. HC, Hierarchical clustering; RAmean, Relative abundance mean.
