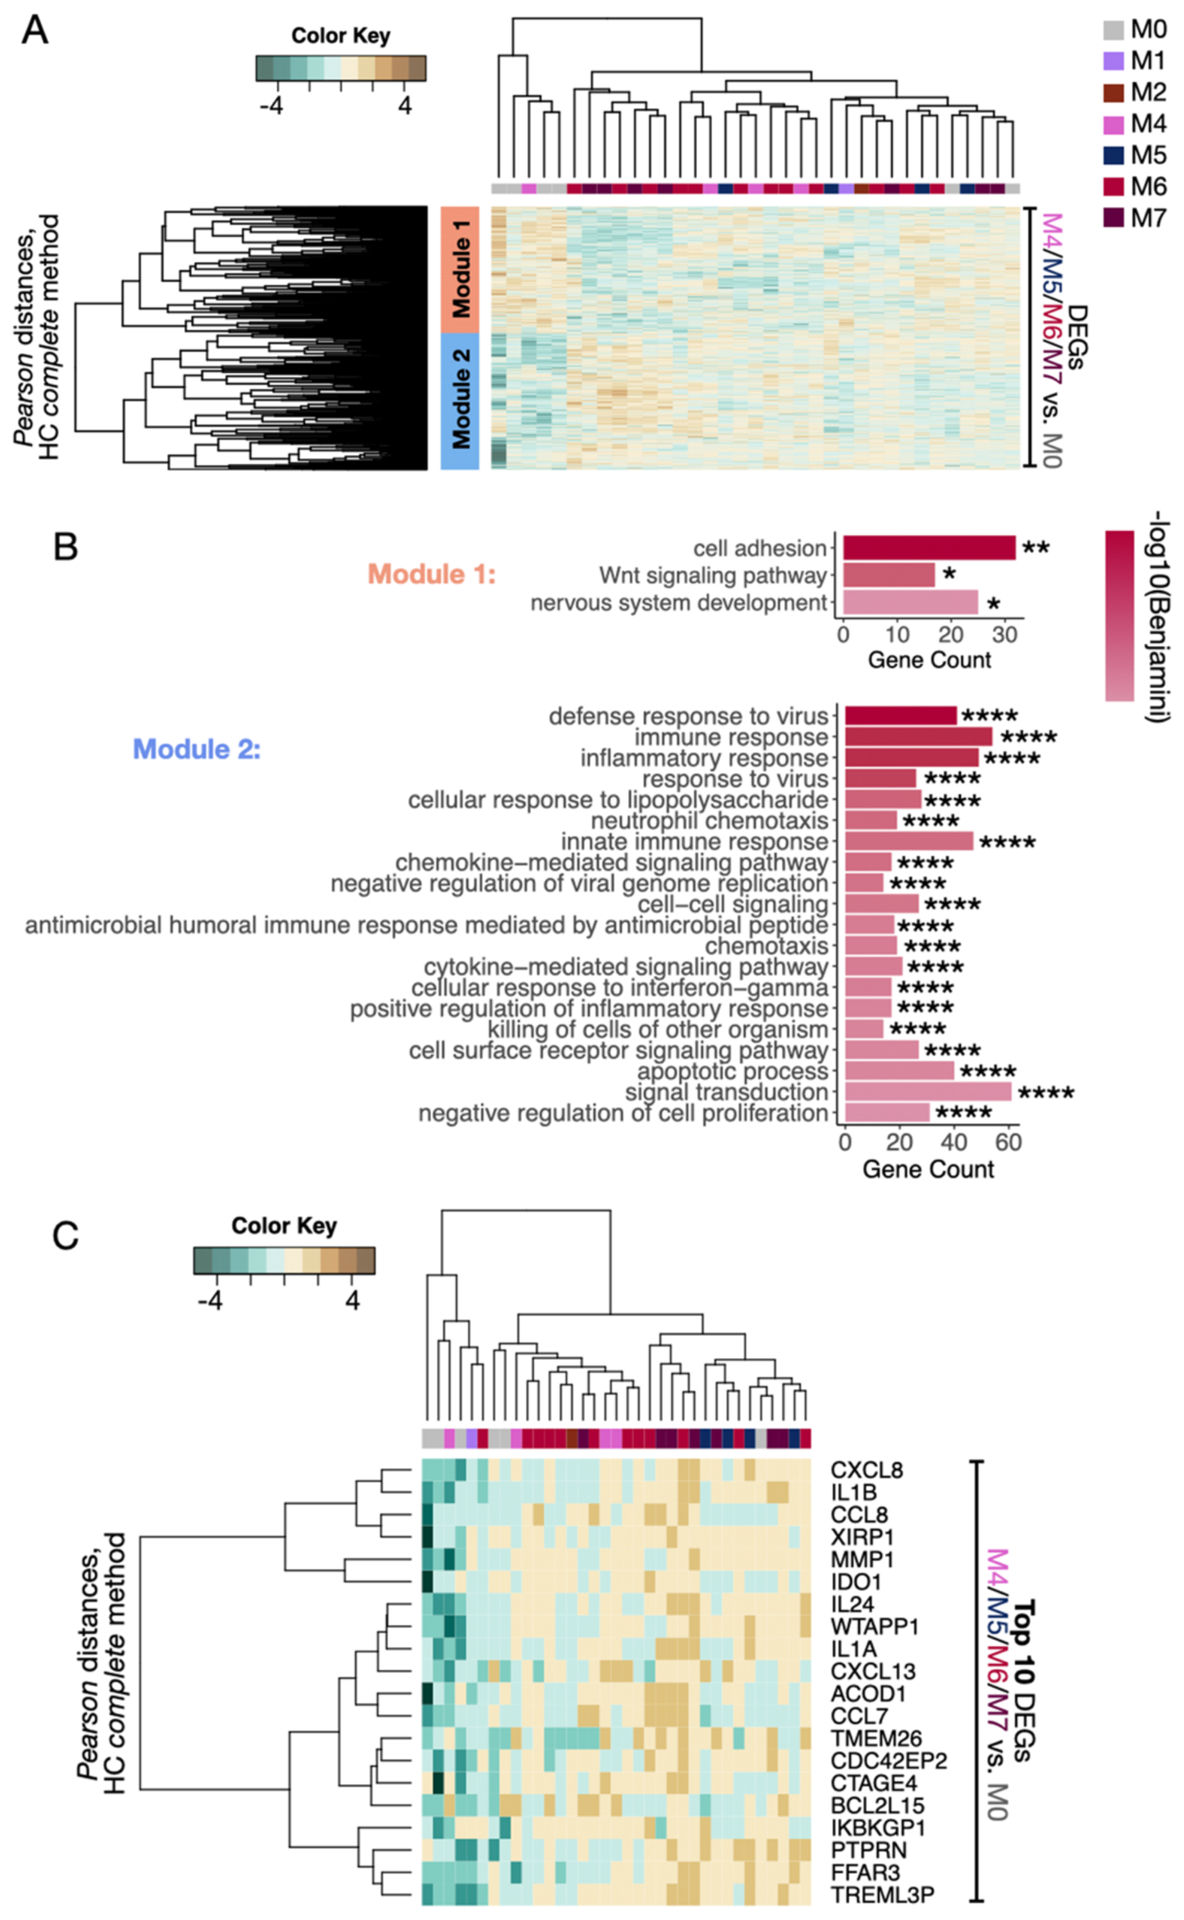
Fig. 4. An altered microbiome is associated with enhanced pro-inflammatory gene expression.

A) Separate DGE analyses were performed between lesions from the reference cluster M0 and clusters M4, M5, M6, and M7. The combined DEGs were then used to classify all lesions according to their transcriptional profiles by unsupervised hierarchical classification (HC) (P<0.05 and fold change>1.5). DGE analyses were not performed with M1, M2 and M3 clusters due to insufficient sample size; however, they were included for unsupervised HC classification. Two gene modules were captured by Pearson’s distances (Module 1: orange, Module 2: blue). B) GO analysis for Biological Processes (BP) terms was carried out in the two gene modules from A. Bar graphs represent the number of genes identified in the GO genesets, and the color scale represents the statistical strength calculated by Benjamini-Bonferroni multiple correction testing. *P<0.05, **P<0.01, ****P<0.0001. C) Top 10 genes from each DGE analysis performed between the lesions from clusters M4, M5, M6, and M7 compared to M0 were concatenated and used to classify all the CL lesions according to their transcriptional profiles by HC. GO, Gene Ontology; DGE, Differential gene expression. DEGs, differentially expressed genes; HC, Hierarchical clustering.
