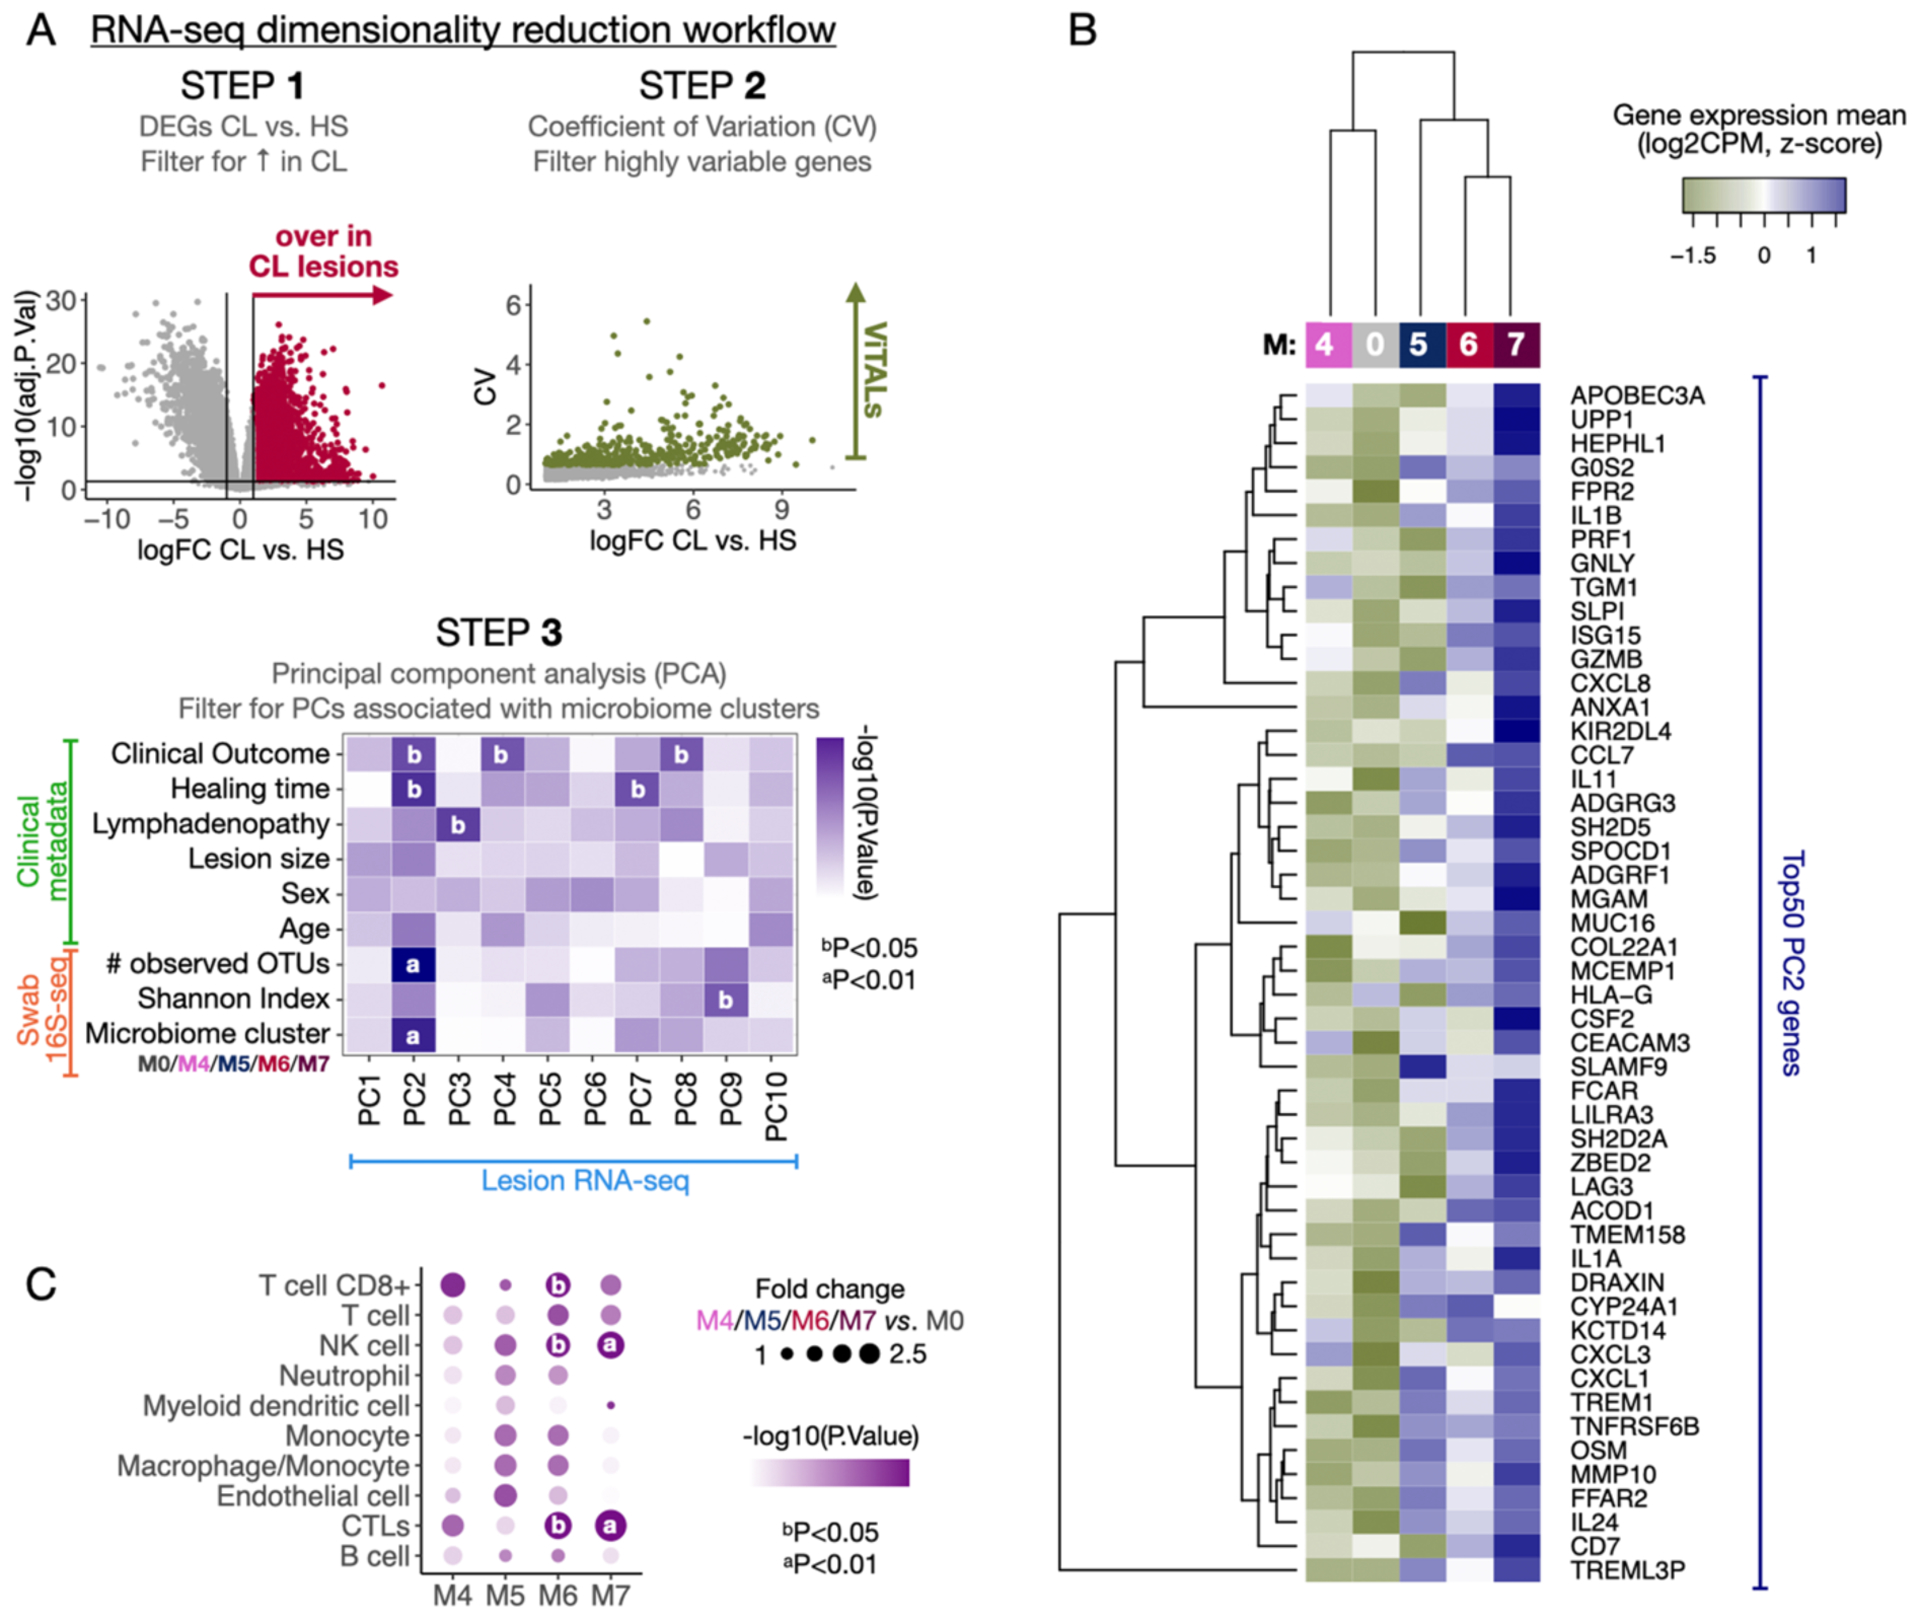
Fig. 5. The distinct CL lesional microbiomes impact the pro-inflammatory gene expression profiles in different magnitudes.

A) A dataset dimensionality reduction computational workflow was performed to integrate output parameters from the three primary datasets included in this study (RNA-seq, 16S-seq, and clinical metadata). Briefly, the gene expression matrix from the RNA-seq was reduced to a list of ~400 genes overrepresented in CL vs. HS (step 1), displaying high variability among CL samples as calculated by the Coefficient of Variation (CV) (step 2). Those genes were ViTALs and were further reduced to PCs in a PCA (step 3). A multivariate linear regression analysis was performed between the PCs and the 16S-seq parameters, and clinical metadata reduced output features. B) Top 50 PC2-associated genes are displayed in a heatmap and classification of transcriptional profiles by the microbiome clusters M4-M7 as calculated with HC. C) MCP-counter was used to estimate the cell population abundances from the RNA-seq dataset. A differential cell population analysis was performed, and the results from M4, M5, M6, and M7 vs. M0 are displayed as fold changes and P-values. PCA, Principal Component Analysis. PC, Principal components. ViTALs, highly variable CL-associated transcripts. HC, hierarchical clustering.
