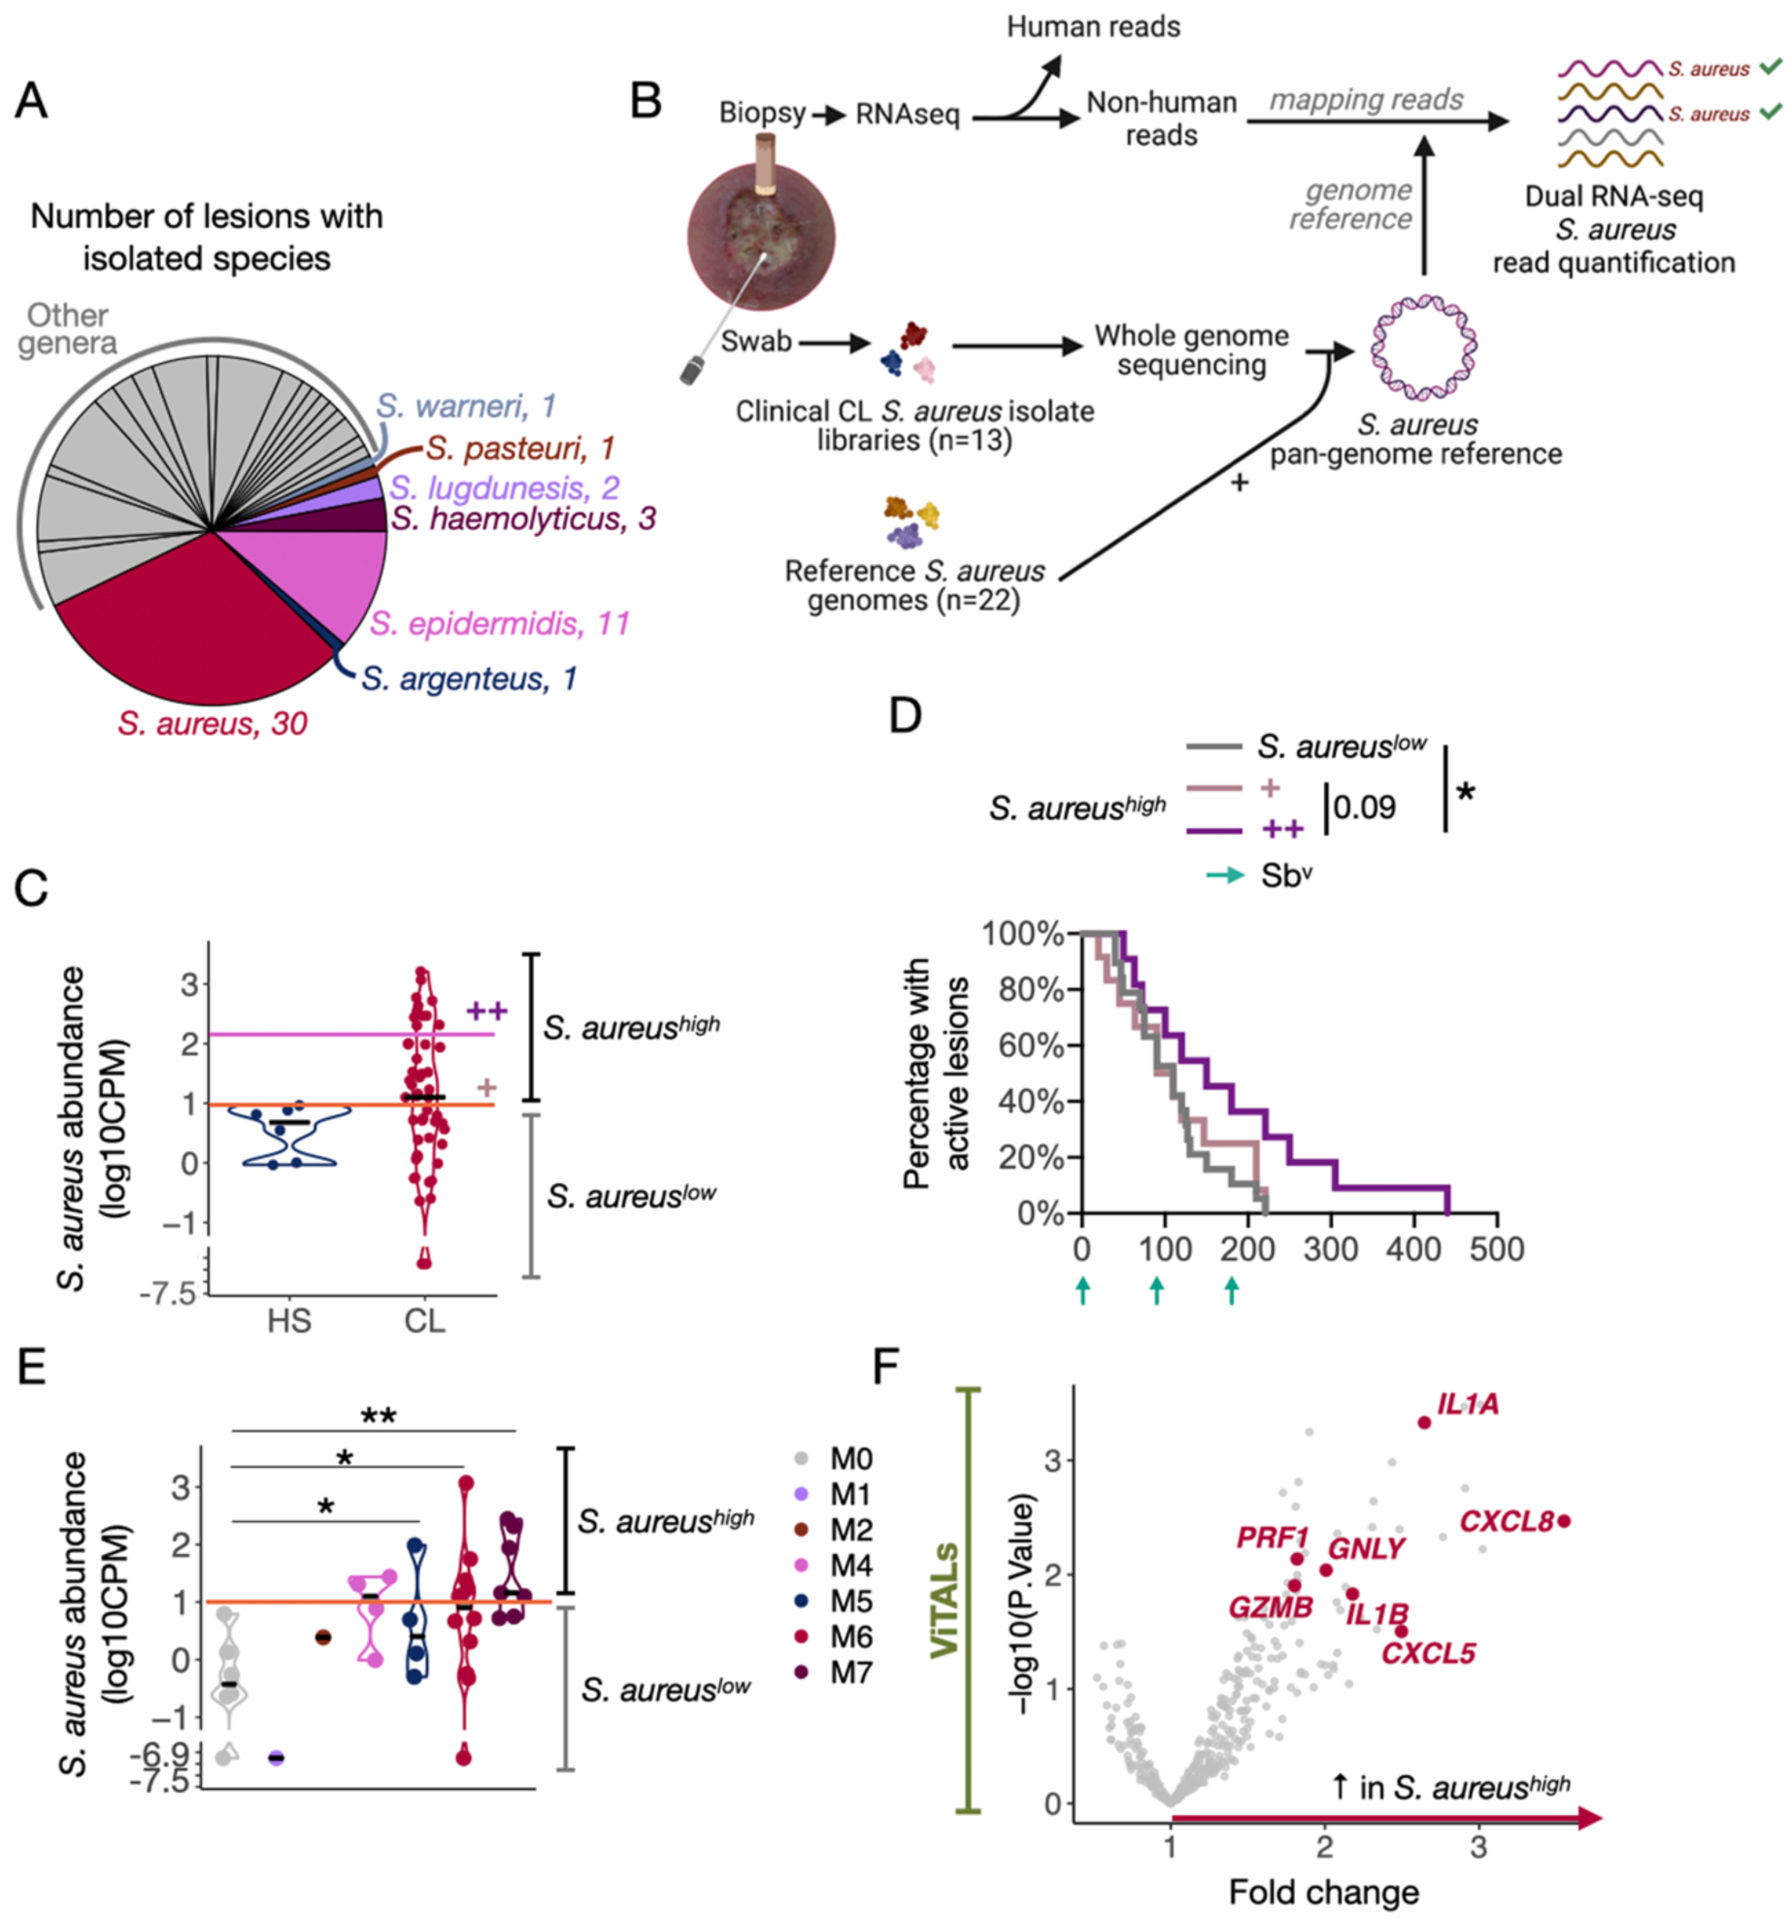
Fig. 6. Dual RNA-seq analysis with an in-house S. aureus pan-genome reference identified the potential host pro-inflammatory mechanisms associated with S. aureus abundances.

A) Name and number of clinical bacteria specimens isolated from 62 CL lesions. Staphylococcus spp. were annotated in the pie chart. B) In-house S. aureus pangenome-based dual RNA-seq workflow to quantify and estimate S. aureus abundances in CL lesions. The non-human reads from the 51 CL RNA-seq samples were mapped to our pangenome reference, which is composed of genomes of 13 CL S. aureus clinical isolates and 22 S. aureus reference publicly available strains. C) Abundance levels quantified in the six healthy RNA-seq lesion samples served as threshold (log10CPM = 1) to divide CL lesions into the groups of increased S. aureus abundances S. aureushigh lesions vs. S. aureuslow lesions. 12 lesions presented overly high S. aureus abundances (S. aureus ++, fold change = 18x) compared to 15 lesions with intermediate levels (S. aureus +, threshold = 2 log10CPM). D) Survival curves for the healing time for S. aureuslow lesions and S. aureus ++ and + abundances (S. aureushigh lesions). Patients who received an alternative form of treatment from an ongoing clinical trial in the clinic were not considered or added to the clinical outcome-related analysis. Log-rank (Mantel-Cox) test was used to calculate the statistical significance, *P<0.05. E) Abundance levels quantified in the CL RNA-seq lesion samples according to their corresponding 16S-Seq microbiome cluster classification. The pink horizontal line indicates the threshold based on HS samples (log10CPM = 1). T-test was used to calculate the statistical significance, *P<0.05 and **P<0.01. F) DGE analysis was performed with ViTALs between S. aureushigh lesions vs. S. aureuslow lesions (FC>1.5 and P<0.05). DGE, Differential gene expression analysis; GO, Gene ontology. FDR; False discovery rate.
