Fig. 3.
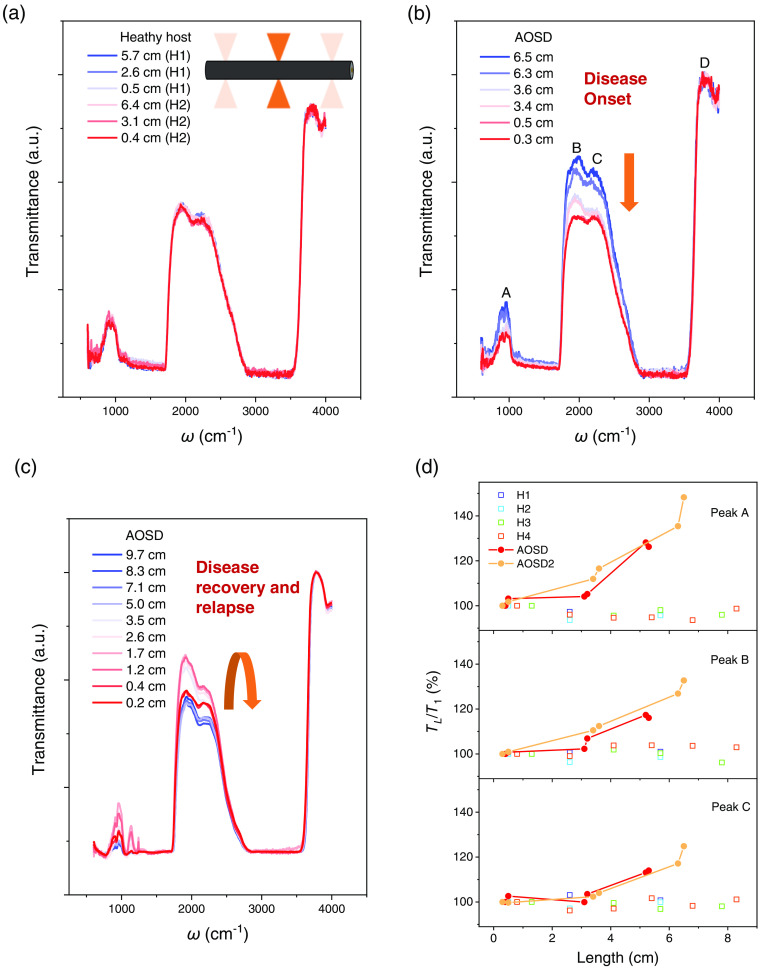
A case study of hair infrared transmission experiments on a P-AOSD. (a) Normalized infrared transmission spectra obtained from different regions of two samples from the same healthy host body. The inset illustrates the realization of spatial-resolved transmission infrared micro-spectra in hair. The length represents the distance between the measured area and the hair follicle. (b) Normalized infrared transmission spectra obtained from different regions of a hair from a P-AOSD. The yellow arrow indicates the decrease of transmittance for peaks A, B, and C, which occurs during the onset of the disease (from blue to red line). (c) Normalized infrared transmission spectra of a hair from the same P-AOSD collected about 11 months later. The yellow arrow indicates the increase and then decrease trend for peaks A, B, and C (from red to blue line), which occurred during the recovery and then relapse of AOSD. (d) The comparison of relative spectral change () with length in hair samples ( to ) from three healthy hosts and that from the AOSD patient (AOSD and AOSD2).

