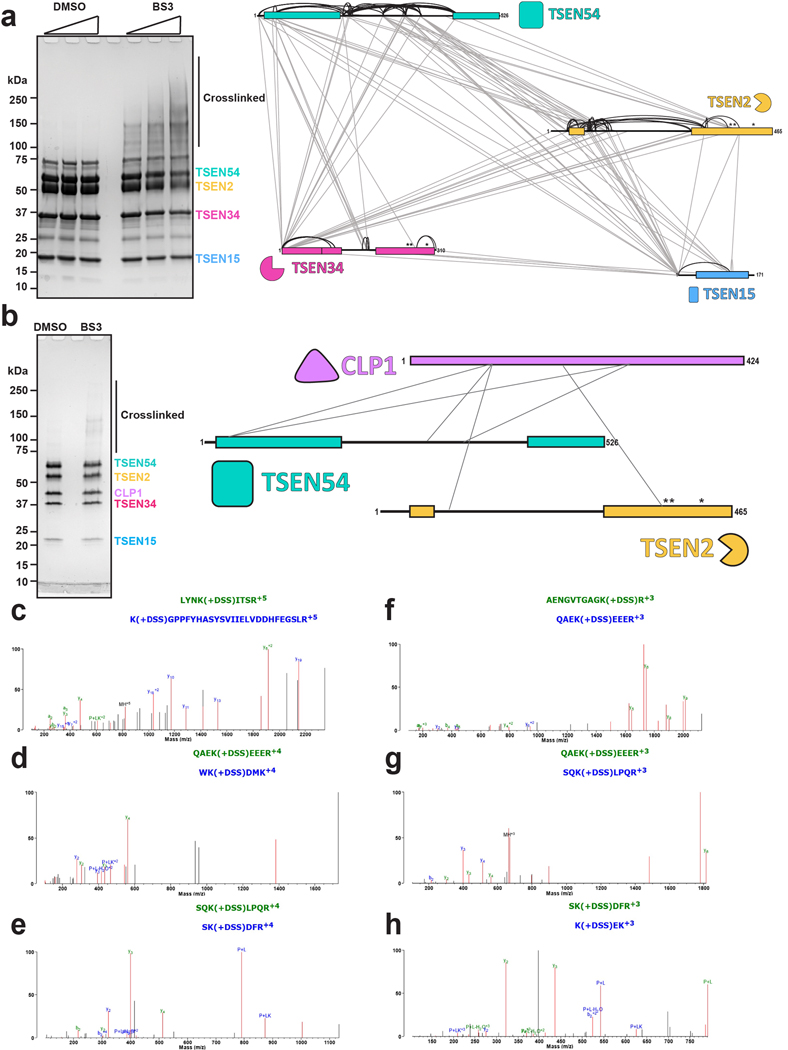
Extended Data Fig. 4. BS3 crosslinking of TSEN complexes.
SDS-Page gels showing the DMSO control and crosslinked samples for a. wt-TSEN complex and b. TSEN Complex and CLP1. c-h. MSMS spectra of CLP1 peptides crosslinked to other members of the complex. Panels c (m/z 822.4292) and d (466.4795 m/z) show MSMS spectra of peptides arising from CLP1 and TSEN2. Panels e (m/z 412.2311), f (m/z 739.0369), g (m/z 671.3516), and h (m/z 398.5568) show MSMS spectra arising from crosslinks from CLP1 and TSEN54. Fragment ions that arise from green colored peptides are shown in green, fragments arising from blue colored peptides are shown in blue, and unassigned ions shown in black.

