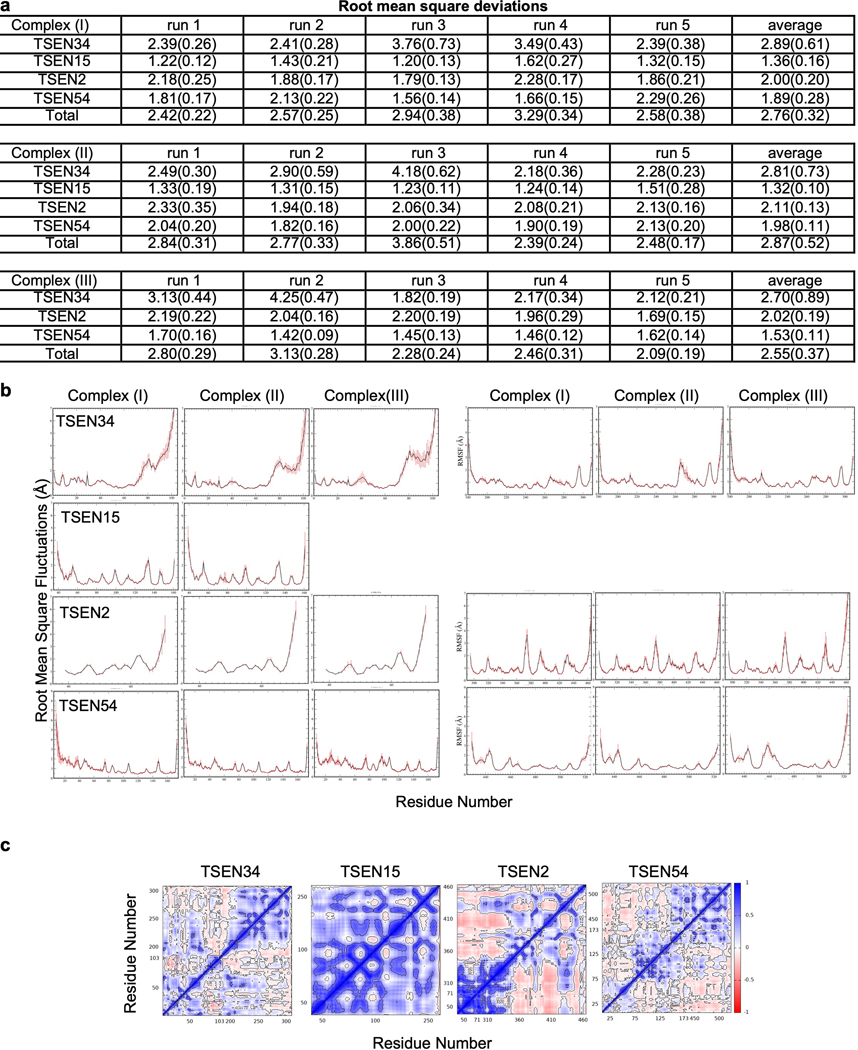
Extended Data Fig. 5. Molecular dynamics simulations account for stable complexes during dynamics.
a. Root mean square deviations (RMSD) of individual proteins and the complex averaged over each run and averaged over the five runs. TSEN34 has the largest deviations while TSEN15 shows smallest deviations irrespective of the RNA binding. Standard deviations are shown in parenthesis. The reference (Complex I) was the starting Cryo-EM configuration. Complex (II) is without tRNA and Complex (III) is without TSEN15. b. Root mean square fluctuations of individual residues averaged calculated during the microsecond dynamics and averaged over all runs. Standard deviations are shown as error bars. c. Representative dynamic cross correlation matrices of the protein components from Complex (I).

