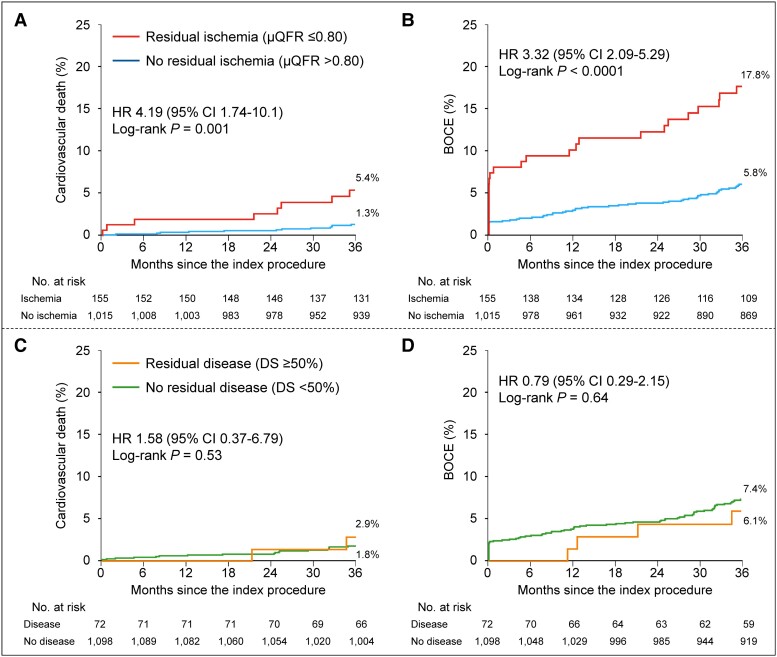
Figure 3.
Time-to-event curves for 3-year clinical outcomes stratified by physiologically significant residual ischemia or residual disease by anatomy. Kaplan–Meier time-to-first event curves showing the 3-year cumulative incidences of cardiovascular death and bifurcation-oriented composite endpoint by physiologically significant residual ischemia (A and B) and residual disease by anatomy (C and D), respectively. BOCE, bifurcation-oriented composite endpoint; CI, confidence interval; CV, cardiovascular; DS, diameter stenosis; HR, hazard ratio; PMI, periprocedural myocardial infarction; other abbreviations as in Figure 1.

