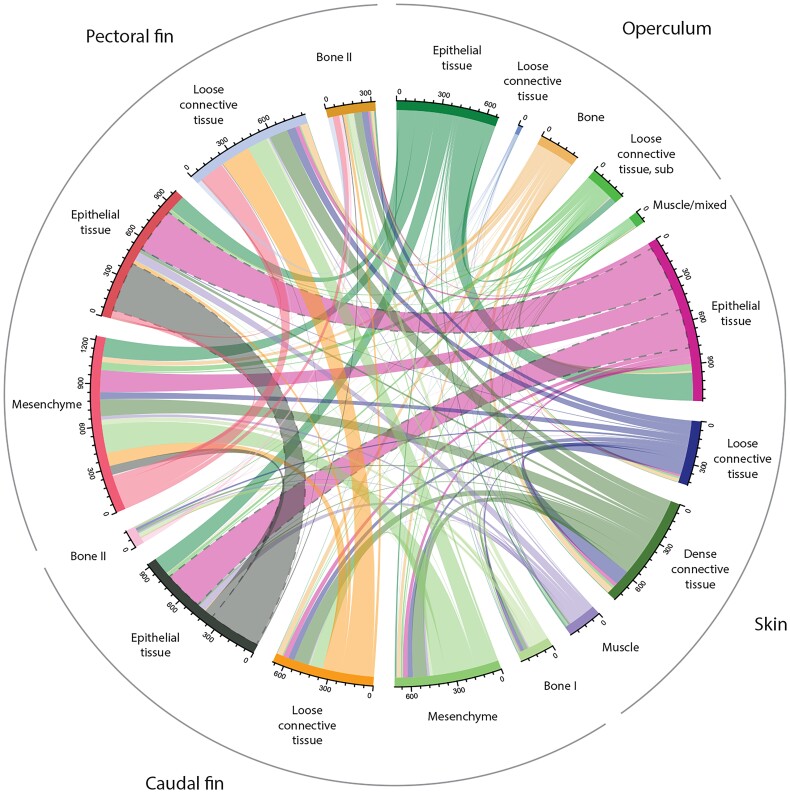
Fig. 6.
Chord diagram displaying the interrelationships between the transcriptional profiles within each cluster. The color and the thickness of the nodes visualize the relationships between the clusters. For operculum, “loose connective tissue, sub” refers to the loose connective tissue under the opercular bone.

