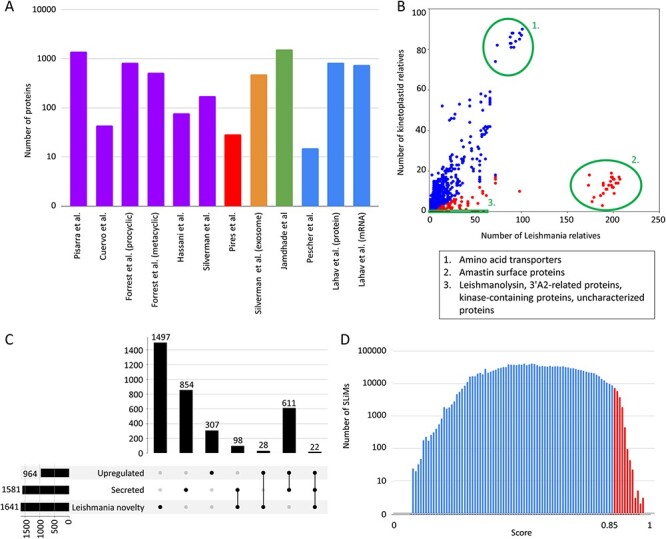
Figure 1.

LeishMANIAdb content. All data were calculated on Leishmania infantum. A: Number of proteins in different proteomic datasets (purple: promastigote secretome, red: amastigote secretome, orange: exosome, green: housekeeping genes, blue: higher protein abundance level upon infection). B: Number of kinetoplastid and Leishmania close homologs. Each dot represents a protein (red: at least 80% of close homologs are in Leishmania, blue: other proteins). Green circles represent distinctive groups. C: Overlap between abundant, secreted and ‘Leishmania novelty’ proteins (for more detail see text). D: Distribution of all predicted SLiMs with different scores. Red marks candidate motifs above 0.85 cutoff (for more details see text).
