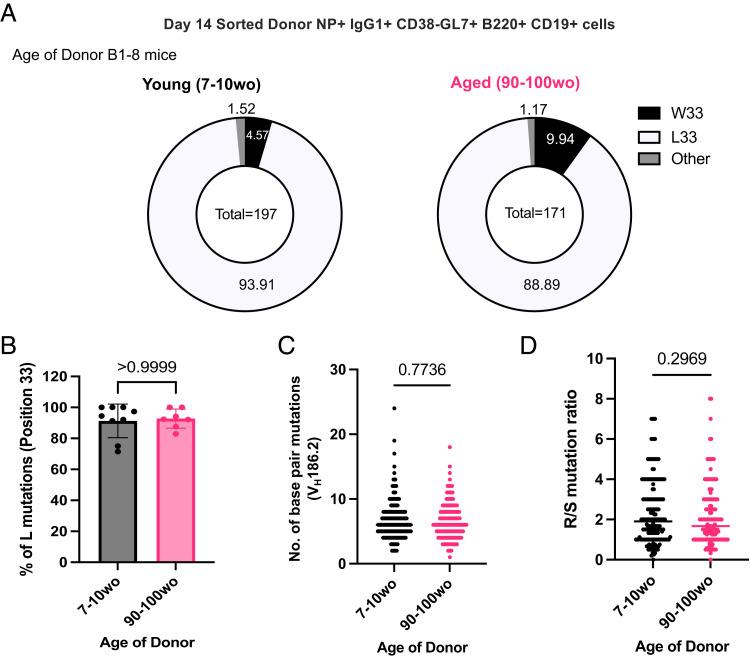
FIGURE 4.
NP-specific B cells from aged mice undergo mutation and selection of high-affinity clones. (A) Pie charts indicating the frequency of the affinity-inducing mutation W33L in the CDR1 of VH186.2 sequenced from single-cell-sorted NP+IgG1+CD38−GL7+B220+CD19+ cells from either young adult (7–10 wo) or aged (90–100 wo) B1-8i mice in iLNs of young adult (8–12 wo) recipient mice 14 d postimmunization with NP-KLH in Alum. The values in the center of the pie charts indicate the total number of cells sequenced per group (n = 7–9 mice per group from two independent experiments, with an average of 20 GC B cells sequenced per mouse). The number of sequences analyzed per recipient mouse is shown in Supplemental Fig. 3A. (B) Graph depicting the percentage of sorted GC B cells with the W33L mutation from young adult (7–10 wo) or aged (90–100 wo) B1-8i mice. Bar height corresponds to the mean, error bars indicate SD, and each symbol represents values from individual recipient mice. (C and D) Graphs depicting the number of single-base-pair mutations (C) and the ratio of replacement: silent mutations (D) in the CDR1 of VH186.2 among sorted GC B cells derived from young adult (7–10 wo) or aged (90–100 wo) mice at day 14 postimmunization. Each symbol represents values from a single sorted GC B cell from seven to nine recipient mice per group. Statistics were calculated using unpaired Mann–Whitney U test. Data are pooled from two independent repeat experiments. wo, wk old.

