. 2023 Oct 12;12:e82739. doi: 10.7554/eLife.82739

Figure 3. Estimated contribution of the three major mechanisms for promoting paradoxical activation (PA).

(A) Schematic of the modeled mechanism of conformational autoinhibition extended to include dimer potentiation (characterized by parameter ‘f’) and negative cooperativity (characterized by parameter ‘g’). (B) Plot of normalized dose–response curves for nine RAF inhibitors based on model fits to the available data (Karoulia et al., 2016). The solid lines represent mean values over N = 259 best fits for each of the 28 parameters varied. The standard deviation is highlighted in corresponding colored highlight. (C) The parameter ‘f’ and drug dissociation constant Kd values from best-fit parameter sets of the unified model (N = 259) fit to nine RAF inhibitors are shown (best-fit KA = 2.914 ± 0.009). The outcomes of best fits for type I, II, and I.5 inhibitors are marked in black, blue, and green, ovals respectively. Dashed line at f = 1 marks the absence of dimer potentiation mechanism. For each drug, we show all obtained best-fit parameter sets that were within 10% of best-fit metric. (D) Mean percentage error per input data for best-fit parameter sets in the unified model compared to models with one mechanism excluded and two mechanisms excluded. The panel on the right presents the parameters included in the corresponding model in light green (and those that are not in dark green). Subscript ‘i’ represents each of the nine drugs.

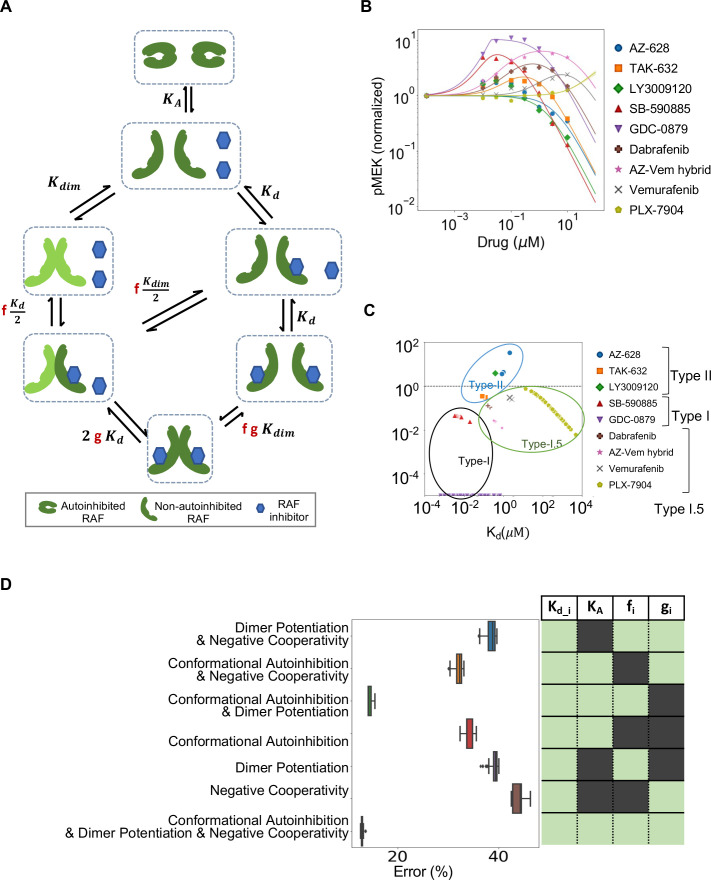
Figure 3.

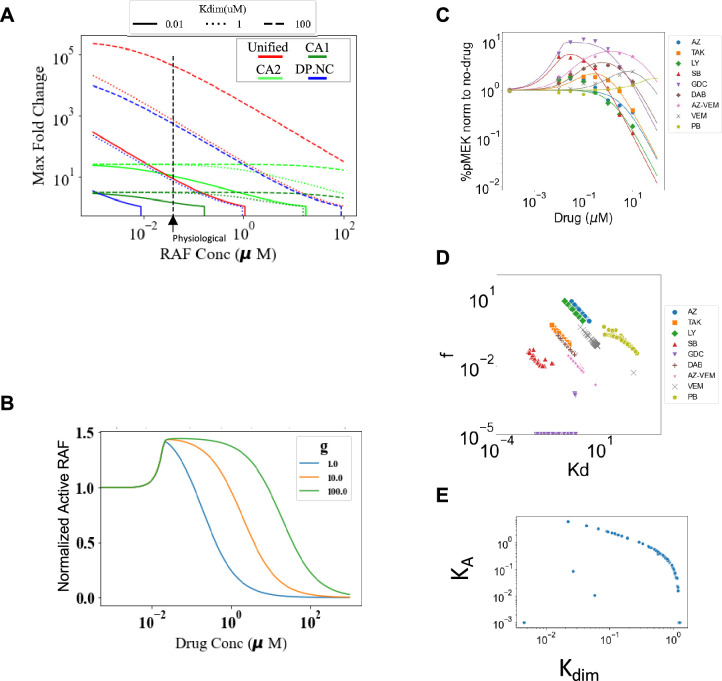
Figure 3—figure supplement 1. Characterizing dimer potentiation (DP), negative cooperativity (NC), and conformational autoinhibition mechanisms of paradoxical activation (PA).

Figure 3—figure supplement 1.

(A) Maximum fold change allowed in the different mechanisms is shown with varying RAF concentrations ([RAF]) and dimerization dissociation rate constant (Kdim). CA1 represents CA mechanism with KA = 10 (10% of RAF is active at baseline and equilibrium) and CA2 represents CA mechanism with KA = 100 (1% of RAF is active at baseline and equilibrium). Extremal values of parameters for DP and NC mechanisms are used to derive maximal respective PA in DP, NC, and unified models (f = 10–5, g = 100). Dashed vertical line shows a physiological estimate of RAF concentration (0.04 μM). The parameters f and g are set to 1 where the respective mechanism of DP, NC is not present. (B) NC mechanism is shown within DP + NC sub-model. NC tweaks PA by extending the PA range of drug concentrations but has no impact on maximum fold change. (C) Plot of normalized dose–response curves for nine RAF inhibitors based on the unified model with all 30 parameters varied fit to the available data (Karoulia et al., 2016). The solid lines represent mean values and highlights represent the standard deviations. (D) Parameter regions predicted when all 30 parameters of the unified model are varied, cover the same regions as in Figure 3C, and distribute the different types of drugs in a similar fashion. However, the best-fit range of parameter values are much wider (on a log-10 scale) than in Figure 3. For each drug, we show all obtained best-fit parameter sets that were within 10% of best-fit metric. (E) With all parameters of the unified model varied, the best-fit correlations between KA values and the RAF dimerization dissociation constant (Kdim) are shown. Direct, monotonic correlation implies choosing Kdim also specifies best-fit KA.
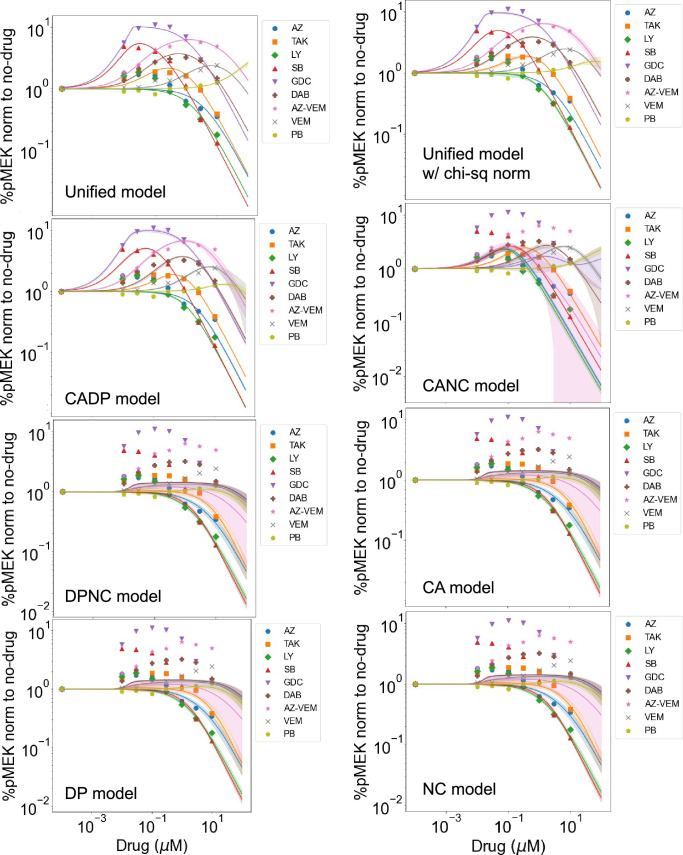
Figure 3—figure supplement 2. Best-fit dose–response curves for all models for each drug.

Figure 3—figure supplement 2.

Normalized dose–response curves for nine RAF inhibitors based on fitting the unified model and all sub-models to the available data (Karoulia et al., 2016). The solid lines represent mean values over best fits for each of the parameters varied. The standard deviation is highlighted in corresponding colored highlight. Unified model is shown when fit with absolute error fitting metric used to compare across different models and with the chi-square-like metric that was used to identify best-fit parameter values.
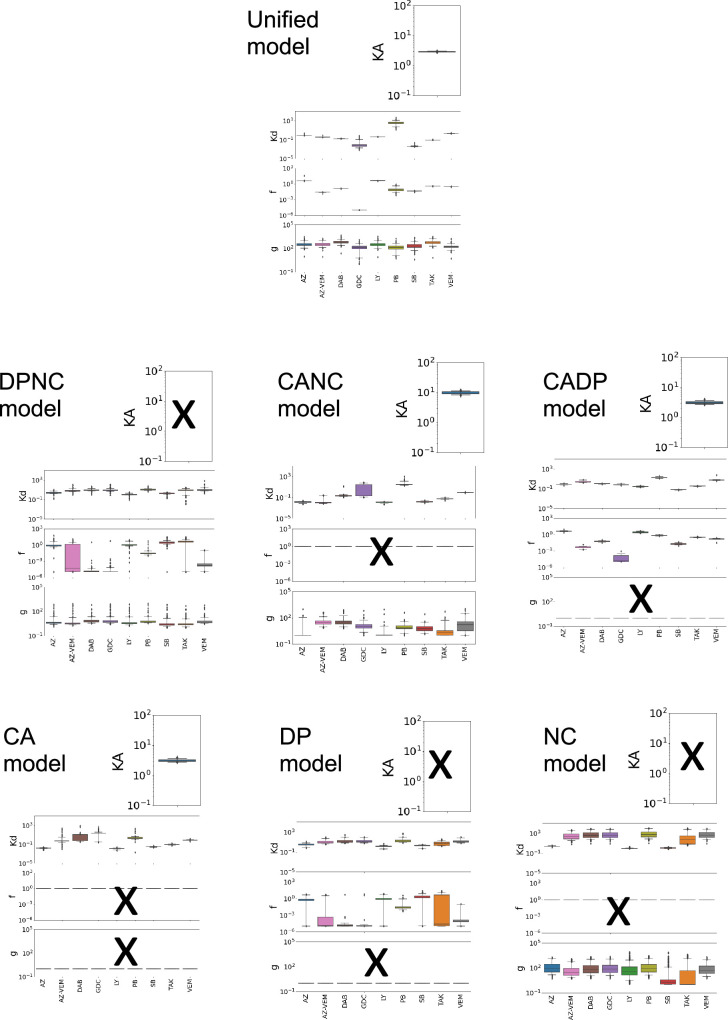
Figure 3—figure supplement 3. Best-fit parameter values compared across different drugs.

Figure 3—figure supplement 3.

Box and whisker plots showing the range of parameter values from our best-fit sets (i.e., parameter sets with an error no more than 10% higher than the parameter set with the least error). Best-fit parameter values for the unified model (28 parameters varied) and all sub-models are shown. Unified model bar charts are copied on each page for reference. The ‘x’ marks represent parameters that were not varied. The axes ranges represent boundaries of the parameter fits. Within the box plots, the boxes indicate quartiles, and the whiskers specify the 95% confidence interval.