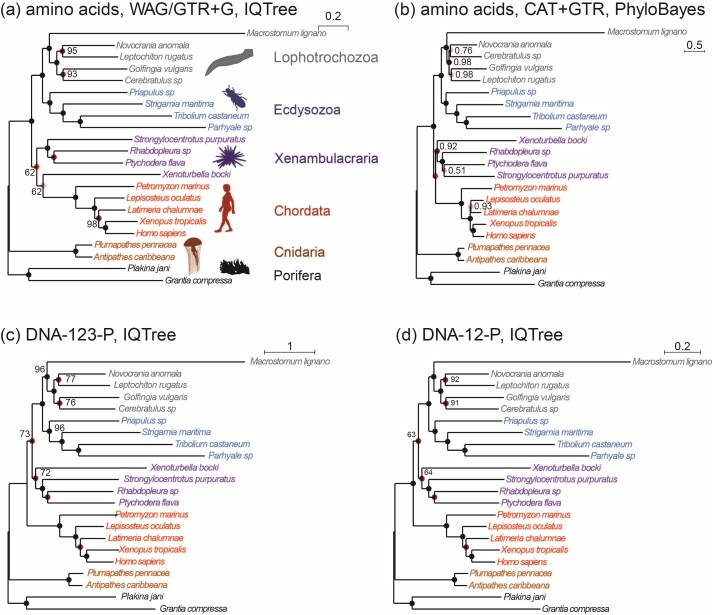
Figure 3.
Phylogenies of 22 animal species reconstructed from ML and Bayesian analyses of an dataset of 941 orthologous genes (440,195 codons or amino acids). (a) The protein sequences are analyzed using IQ-tree under the WAG+G and GTR+G models. (b) The protein alignment for one of the two data subsets ( sites) is analyzed under the CAT+GTR model using PhyloBayes (the topology for the second subset is shown in Supplementary Fig. S1). (c) The DNA sequence data are analyzed under a nucleotide partition model with three partitions for the 3 codon positions. (d) The first and second codon positions are analyzed using IQ-tree under a nucleotide partition model. Note that trees C and D are identical. The color of the circles on the nodes indicates whether the node is recovered in all 4 (black), in 3 (dark red), or in two (red) analyses or in only one analysis (pink). The number next to each internal node represents the bootstrap support (or the posterior probability for phylobayes) for the node (not shown if 100%).

