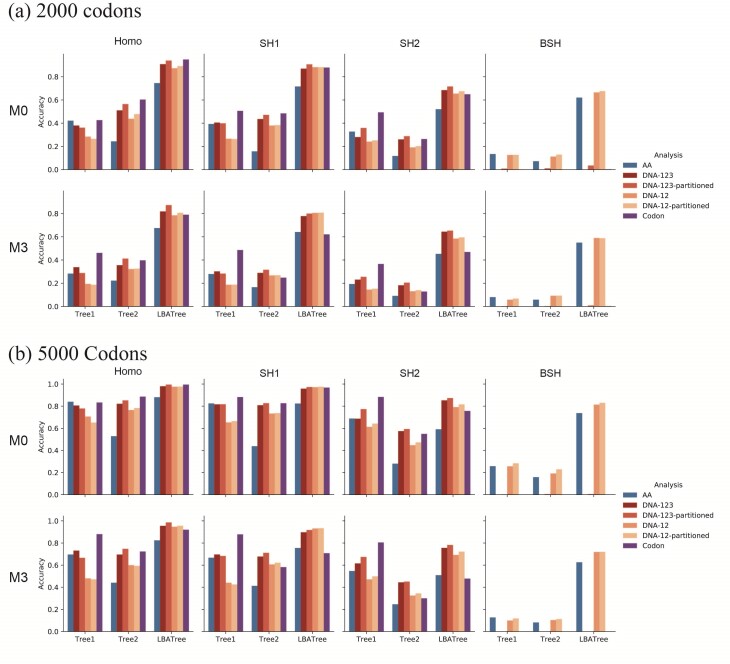
Figure 4.
Probability of recovering the correct tree in 1000 replicate datasets with (a) 2000 sites or (b) 5000 sites simulated assuming the shallow trees of Figure 1. The models assumed to generate data are as follows. The selective pressure on nonsynonymous mutations was either homogeneous among sites (M0: 1  ) or variable (M3: 3
  s) (Nielsen and Yang 1998)). The codon frequencies are modelled using four different models (homo, SH1, SH2, and BSH). Homo is the homogeneous model with one set of codon frequencies for all sites in the sequence and all branches on the tree. SH1 assumes site-heterogeneous codon-frequencies generated from observed codon frequencies in coding genes from two mammal species. SH2 assumes site-heterogeneous codon-frequencies generated using the amino acid frequencies in the C10 mixture model, multiplied by nucleotide frequencies at the third codon position. BSH assumes branch-site-heterogeneous codon frequencies as in SH2, but with additional among-branch nucleotide-frequency heterogeneity. The six data-analysis strategies are “AA”: analysis of amino acid sequences under the WAG+G model; “DNA-123”: analysis of nucleotide sequences of all three codon positions using the nucleotide model GTR+G; ‘DNA-123-P’: analysis of all three codon positions using a nucleotide partition model that assigns different rates and base frequencies to the three codon positions (Yang et al. 1995b; Yang 1996b)); “DNA-12”: analysis of codon positions 1 and 2 using the nucleotide model GTR+G; “DNA-12-P”: analysis of codon positions 1 and 2 using a nucleotide partition model; and “codon”: analysis of the codon sequences (all three codon positions) using the codon model M0 (one-ratio) (Nielsen and Yang 1998).

