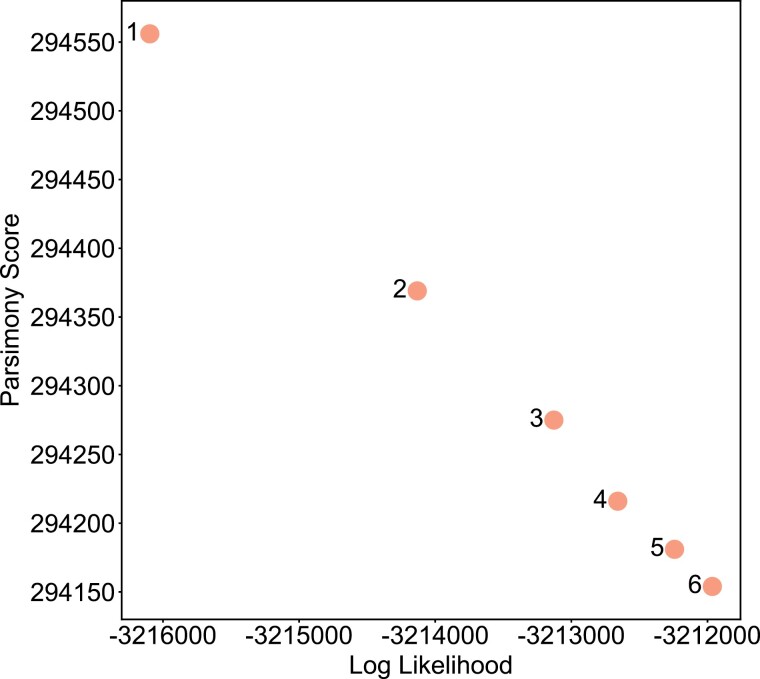
Figure 5.
Improvement in likelihood and parsimony have a linear relationship for our optimized global tree. We optimized our initial global tree using 6 iterations of FastTree and measured the total parsimony and the likelihood after each, finding a linear relationship (Pearson correlation, rho = –1.0, P < 2.9 × 10⁻⁷).

