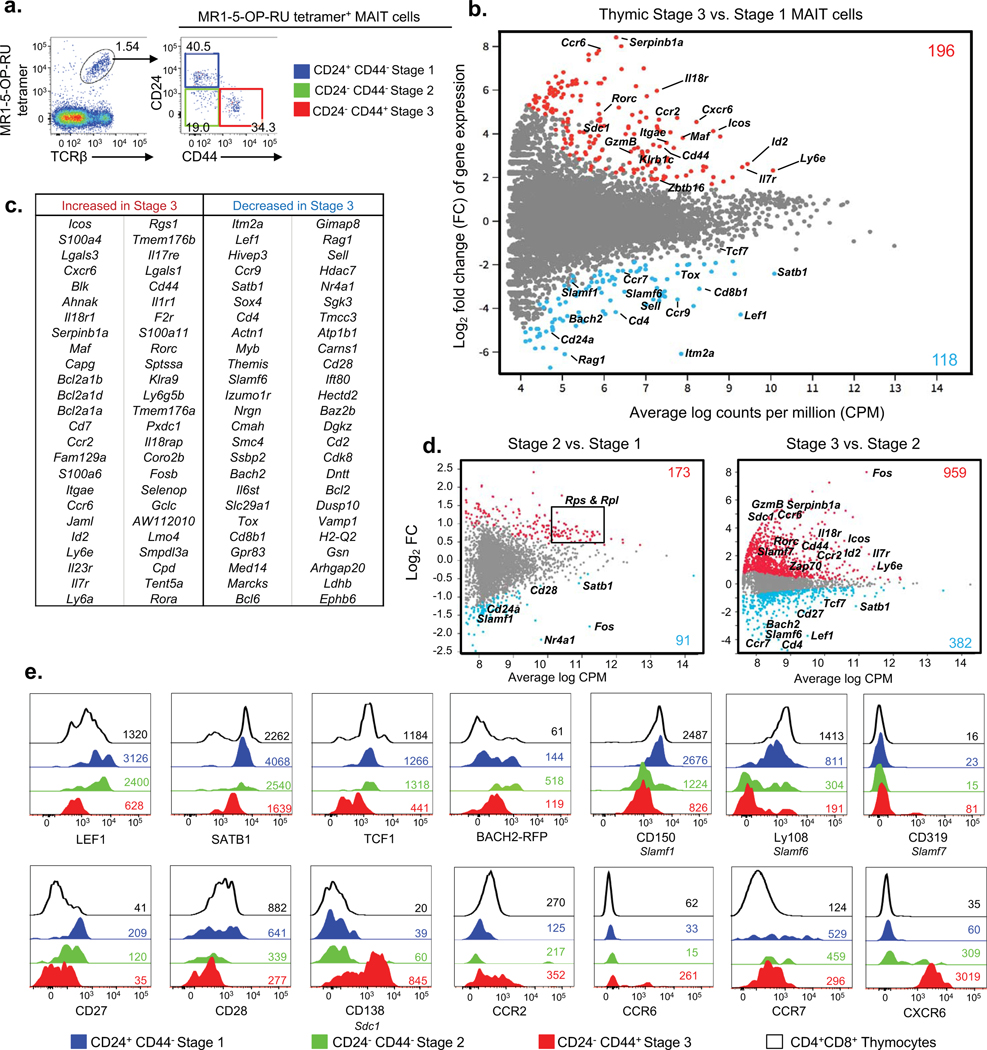
Figure 1. Transcriptomic analysis of mouse MAIT cell development.
a. Flow cytometric analysis of 3 stages of mouse thymic MAIT cells post MR1–5-OP-RU tetramer enrichment. MAIT cell stages are defined with CD24 and CD44; stage 1 (S1, CD24+CD44−) in blue, stage 2 (S2, CD24−CD44−) in green and stage 3 (S3, CD24−CD44+) in red. b. MD plot showing gene expression comparison of bulk-cell purified stage 3 versus stage 1 MAIT cells. Colored dots indicate genes significantly up-regulated in stage 3 (red) and stage 1 (blue). Colored numbers represent the total number of differentially expressed genes (DEG). (c) Table lists the top 50 most DEGs within each subset. b, c. Data are from 3 pooled biological replicates each generated from a pool of thymi from five mice. d. Gene expression comparison of single-cell purified stage 2 versus stage 1 (left) and stage 3 versus stage 2 (right) MAIT cells. e. Phenotypic analysis of thymic MAIT cell stages for expression of transcription factors LEF1 (encoded by gene Lef1), SATB1 (Satb1), TCF1 (Tcf7), Bach2 (Bach2); SLAM molecules CD150 (Slamf1), Ly108 (Slamf6), and CD319 (Slamf7); costimulation receptors CD27 (Cd27) and CD28 (Cd28); glycoprotein CD138 (Sdc1) and chemokine receptors CCR2 (Ccr2), CCR6 (Ccr6), CCR7 (Ccr7) and CXCR6 (Cxcr6). Histograms depict stage 1 MAIT cells in blue, stage 2 MAIT cells in green, stage 3 MAIT cells in red, CD4+CD8+ double positive (DP) thymocytes in black. Coloured numbers indicate mean fluorescence intensity values (MFI) of each marker for the respective cell population. a, e. Data are representative of at least 2 independent experiments with a total of 2 separate samples (pools of 3 thymi).

