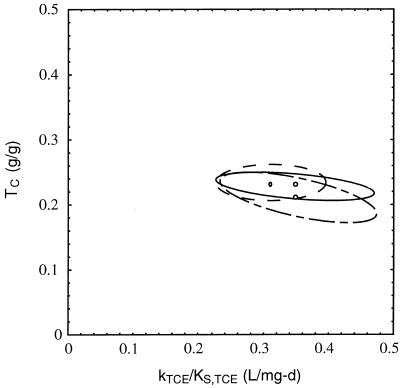
FIG. 4.
Joint 95% confidence regions for kTCE/KS,TCE and TC for the TCE cometabolism results shown in Fig. 3, using the numerical model (— – —), the numerical model with simplifying assumptions (—), and integrated Monod equation weighted least-squares analysis (–––). L, liter; d, day.

