


Fig.2. Changes in CAC.
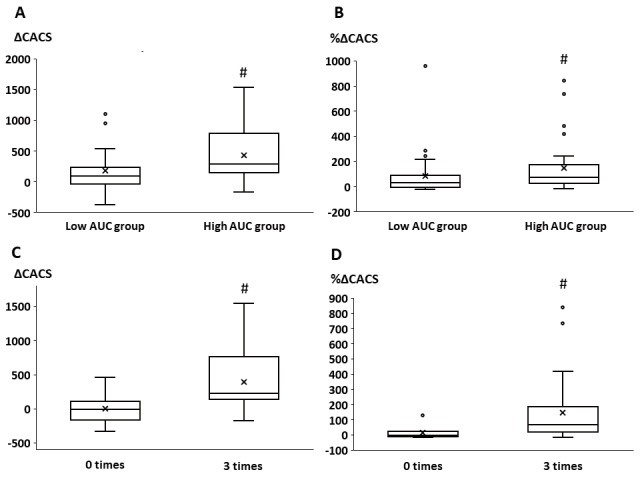
A. Changes in CACS between the low and high AUC groups
B. Percentage changes in CACS between the low and high AUC groups
C. Changes in CACS between patients with zero excursions from the target serum phosphate range and those with three excursions
D. Percentage changes in CACS between patients with zero excursions from the target serum phosphate range and those with three excursions
CAC, coronary artery calcification; CACS, coronary artery calcification score; AUC, area under the curve
#; p<0.05