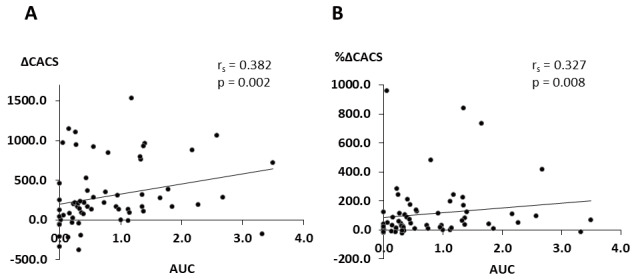
Fig.3. Correlation between changes in CAC and AUC for serum phosphate levels.

A. Relationship between changes in CACS and AUC
B. Relationship between percentage changes in CACS and AUC
CAC, coronary artery calcification; CACS, coronary artery calcification score; AUC, area under the curve
