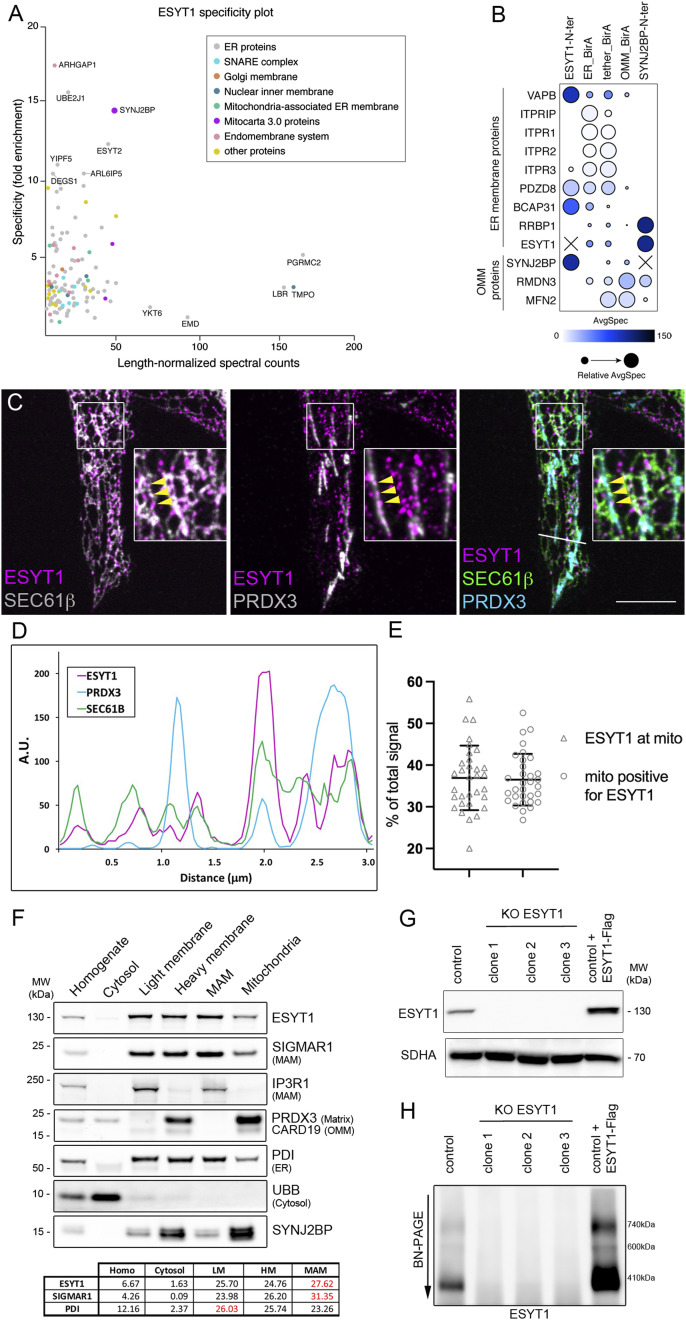
Figure 1. ESYT1 localizes to mitochondria–ER contact sites where it interacts with SYNJ2BP.
(A) Specificity plot of ESYT1-N-ter BioID analysis indicates the specific proximity interaction with SYNJ2BP. The specificity denotes the fold enrichment of the spectral counts detected for each prey in the ESYT1 BioID compared with the spectral counts for that prey in all other baits in the dataset (all four SMP proteins). Prey names for the most specific preys and for preys with the highest length-normalized spectral counts are indicated. Preys are colour-coded based on their GO term cellular compartment analysis. MitoCarta3.0 proteins are SYNJ2BP, FKBP8, and ALDH3A2. (B) Proximity interaction between known (and predicted) ER–mitochondrial tethers with indicated baits (BFDR ≤ 0.01). The colour of each circle represents the prey-length normalized average spectra detected for the indicated protein by each bait and the size of the circle represents the relative average spectra across the baits analyzed in this dataset. The SAINT analysis excludes self-detection for the bait protein as a prey, and is represented as X in the graph. (C) Confocal microscopy images of endogenous ESYT1 localization (magenta) in human fibroblasts stably overexpressing SEC61B-mCherry as an ER marker (green). Staining for endogenous PRDX3 serves as a mitochondrial marker (cyan). Yellow arrows point to foci of ESYT1 colocalizing with both ER and mitochondria. Scale bar = 5 μm. (D) Line scan of fluorescence intensities demonstrating focal accumulations of endogenous ESYT1 along the ER network that partially colocalize with mitochondria (A.U. = arbitrary units). (E) Quantitative confocal microscopy analysis of endogenous ESYT1 localization in control human fibroblasts stably overexpressing SEC61B-mCherry as an ER marker, labelled with ESYT1 and with TOMM40 as a mitochondrial marker. Percentage of ESYT1 signal colocalizing with mitochondria and percentage of mitochondria positive for ESYT1 were assessed. Results are expressed as means ± S.D. (n = 32). (F) Subcellular localization of endogenous ESYT1 and SYNJ2BP. Mouse liver was fractionated, and the fractions were analyzed by SDS–PAGE and immunoblotting. SIGMAR1 and IP3R1 are MAM markers, PRDX3 is a mitochondrial matrix marker, CARD19 is an outer mitochondrial membrane marker, PDI is an ER marker, and UBB is a cytosol marker. The percentage of ESYT1, SIGMAR1, and PDI signal in each fraction is shown. (G) ESYT1 protein levels in control human fibroblast, three individual clones of ESYT1 knock-out fibroblasts and fibroblasts overexpressing ESYT1-3xFLAG. Whole-cell lysates were analyzed by SDS–PAGE and immunoblotting. SDHA was used as a loading control. (H) Characterization of the ESYT1 complexes. Heavy membrane fractions were isolated from control human fibroblasts, ESYT1 knock-out fibroblasts, and fibroblasts overexpressing ESYT1-3xFLAG, solubilized with 1% DDM and analyzed by blue native PAGE.

