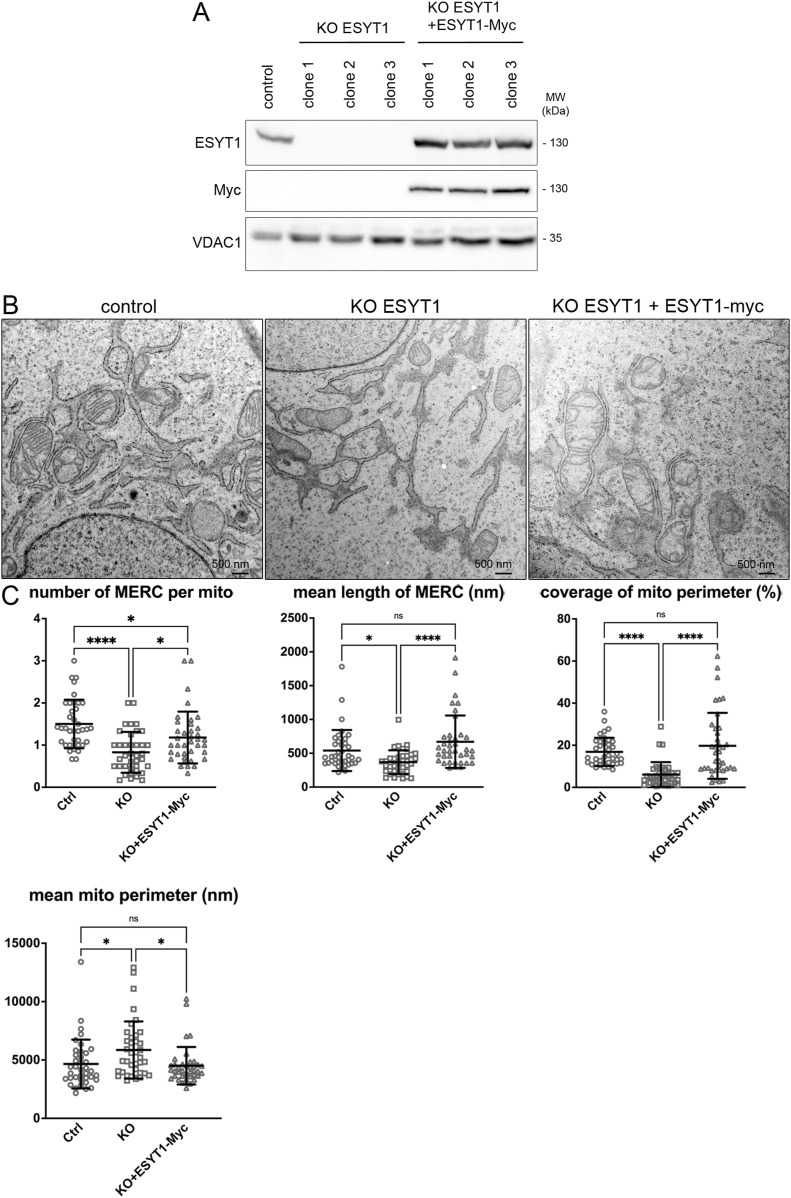
Figure 2. Loss of ESYT1 decreases MERCs.
(A) ESYT1 protein levels in control human fibroblasts, ESYT1 knock-out fibroblasts, and ESYT1 knock-out fibroblasts expressing ESYT1-Myc. Whole cell lysates were analyzed by SDS–PAGE and immunoblotting. VDAC1 was used as a loading control. (B) Transmission electron microscopy images of control human fibroblasts, ESYT1 knock-out fibroblasts, and ESYT1 knock-out fibroblasts expressing ESYT1-Myc. (C) Quantitative analysis of Mitochondria–ER contact sites (MERCs) from the TEM images: number of MERC per mitochondria, length of MERC (nm), coverage of the mitochondrial perimeter by ER (%), and mitochondrial perimeter (nm). Results are expressed as means ± S.D. Images in each condition were analyzed (n = 38), totaling 245 mitochondria for control cells, 154 mitochondria for KO cells, and 224 mitochondria for rescued cells. Kruskal–Wallis and post hoc multiple comparisons tests were applied, ns: nonsignificant, *P < 0.05, ****P < 0.0005.

