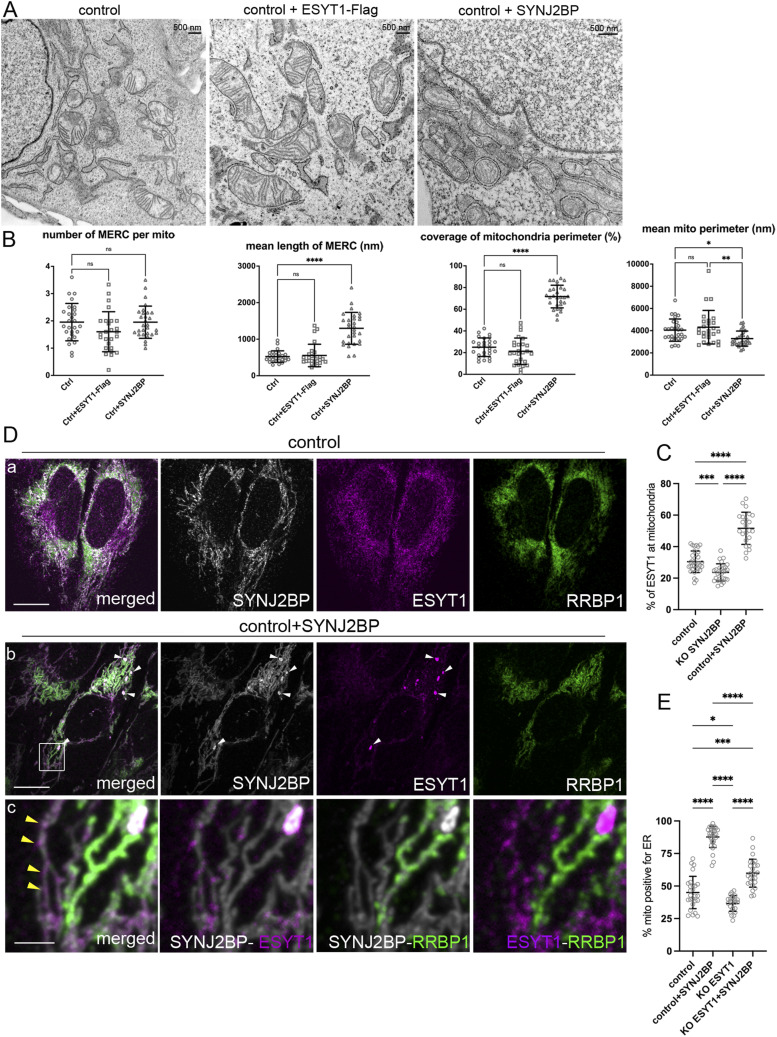
Figure 3. SYNJ2BP but not ESYT1 promotes the formation of mitochondria–ER contacts.
(A) Transmission electron microscopy images of control human fibroblasts, fibroblasts overexpressing ESYT1-FLAG, and fibroblasts overexpressing SYNJ2BP. (B) Quantitative analysis of mitochondria–ER contact sites (MERCs) in control human fibroblasts, fibroblasts overexpressing ESYT1-FLAG, and fibroblasts overexpressing SYNJ2BP showing the number of MERC per mitochondria, the length of MERC (nm), and the coverage of the mitochondrial perimeter by ER (%), and mitochondrial perimeter (nm). Results are expressed as means ± S.D. Images were analyzed in control fibroblasts (n = 27), totaling 152 mitochondria; in fibroblasts overexpressing ESYT1-FLAG (n = 26), totaling 140 mitochondria; in fibroblasts overexpressing SYNJ2BP (n = 29), totaling 300 mitochondria. Kruskal–Wallis and post hoc multiple comparisons tests were applied, ns: nonsignificant, *P < 0.05, **P < 0.01, ****P < 0.0005. (C) Quantitative confocal microscopy analysis of endogenous ESYT1 colocalization with mitochondria in control human fibroblasts (n = 32), SYNJ2BP KO fibroblasts (n = 28), and fibroblasts overexpressing SYNJ2BP (n = 23). Cells were labelled with ESYT1 and PRDX3 as a mitochondrial marker. Results are expressed as means ± S.D. ***P < 0.0005; ****P < 0.0001 (Brown–Forsythe and Welch ANOVA test). (D) Confocal microscopy images of control human fibroblasts (a) and fibroblasts overexpressing SYNJ2BP (b, c) showing SYNJ2BP localization (grey), ESYT1 localization (magenta), and RRBP1 localization (green). White arrows point to large foci of endogenous ESYT1 colocalizing with SYNJ2BP accumulations when SYNJ2BP is overexpressed. Scale bar = 10 μm. (c): zoomed image from (b) showing ESYT1 and RRBP1 accumulation in different mitochondria when SYNJ2BP is overexpressed. Yellow arrowheads point to mitochondrial ghost pattern for ESYT1 localization when SYNJ2BP is overexpressed. Scale bar = 2 μm. (E) Quantitative confocal microscopy analysis of mitochondria positive for ER in control human fibroblasts (n = 26), SYNJ2BP overexpressing fibroblasts (n = 29), ESYT1 KO fibroblasts (n = 24) and ESYT1 KO fibroblasts overexpressing SYNJ2BP (n = 26). Cells were labelled with PRDX3 as a mitochondrial marker and CANX as an ER marker. Results are expressed as means ± S.D. *P < 0.05; ***P < 0.0005; ****P < 0.0001 (Brown–Forsythe and Welch ANOVA test).

