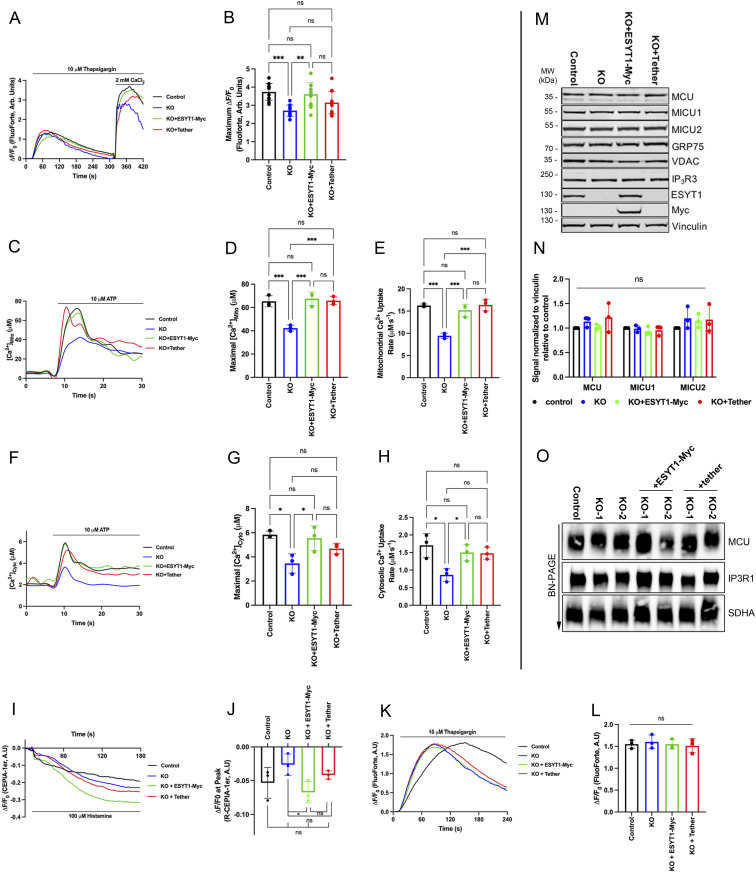
Figure 6. ESYT1 is required for ER to mitochondria Ca2+ transfer in human fibroblasts.
(A) Trace of cytosolic Ca2+ probe Fluoforte in control human fibroblasts, ESYT1 KO fibroblasts, ESYT1 KO fibroblasts expressing ESYT1–Myc, or an artificial mitochondria–ER tether, after treatment with thapsigargin (10 μM) and addition of 2 mM CaCl2. (B) Quantification of maximal fold change in cytosolic Ca2+ levels from thapsigargin-induced ER Ca2+ depletion to maximal cytosolic signal in control human fibroblasts, ESYT1 KO fibroblasts, ESYT1 KO fibroblasts expressing ESYT1–Myc, or an artificial mitochondria–ER tether. Results are expressed as mean ± SD from >50 cells per condition; n = 3 independent experiments. ns: not significant; *P < 0.05; **P < 0.01; ***P < 0.001 (Turkey’s multiple comparisons test). (C) Trace of mitochondrial–aequorin measurements of mitochondrial Ca2+ levels upon ATP (10 μM) stimulation in control human fibroblasts, ESYT1 KO fibroblasts, ESYT1 KO fibroblasts expressing ESYT1-Myc, or an artificial mitochondria–ER tether. (D) Quantification of maximal mitochondrial Ca2+ levels in control human fibroblasts, ESYT1 KO fibroblasts, ESYT1 KO fibroblasts expressing ESYT1–Myc or an artificial mitochondria–ER tether. Results are expressed as mean ± SD from >50 cells per condition; n = 3 independent experiments. ns: not significant; **P < 0.01 (Turkey’s multiple comparisons test). (E) Quantification of the rate of mitochondrial Ca2+ uptake in control human fibroblasts, ESYT1 KO fibroblasts, ESYT1 KO fibroblasts expressing ESYT1–Myc or an artificial mitochondria–ER tether. Results are expressed as mean ± SD from >50 cells per condition; n = 3 independent experiments. ns: not significant; *P < 0.05; **P < 0.01; ***P < 0.001 (Turkey’s multiple comparisons test). (F) Representative trace of cytosolic-aequorin measurements of mitochondrial Ca2+ levels upon ATP (10 μM) stimulation in control human fibroblasts, ESYT1 KO fibroblasts, ESYT1 KO fibroblasts expressing ESYT1–Myc or an artificial mitochondria–ER tether. Results are expressed as mean ± SD from >50 cells per condition; n = 3 independent experiments. ns: not significant; *P < 0.05; **P < 0.01; ***P < 0.001 (Turkey’s multiple comparisons test). (G) Quantification of maximal cytosolic Ca2+ levels in control human fibroblasts, ESYT1 KO fibroblasts, ESYT1 KO fibroblasts expressing ESYT1–Myc or an artificial mitochondria–ER tether. Results are expressed as mean ± SD from >50 cells per condition; n = 3 independent experiments. ns: not significant; *P < 0.05; **P < 0.01; ***P < 0.001 (Turkey’s multiple comparisons test). (H) Quantification of the rate of cytosolic Ca2+ uptake in control human fibroblasts, ESYT1 KO fibroblasts, ESYT1 KO fibroblasts expressing ESYT1–Myc or an artificial mitochondria–ER tether. Results are expressed as mean ± SD from >50 cells per condition; n = 3 independent experiments. ns: not significant; *P < 0.05; **P < 0.01; ***P < 0.001 (Turkey’s multiple comparisons test). (I) Trace of ER Ca2+ in control human fibroblasts, ESYT1 knock-out fibroblasts, ESYT1 knock-out fibroblasts expressing either ESYT1–Myc or an artificial mitochondria–ER tether. All cell lines express the ER-targeted GECI (ER-G-CEPIA1er) fluorescent probe. ER-Ca2+ release was stimulated with 100 μM histamine after 10 s of baseline (F/F0 ER-G-CEPIA1er). (J) Quantification of the fold-change in fluorescence intensity (ΔF/F0) of CEPIA-1er at the initial peak induced by histamine. Results are expressed as mean ± SD; from >50 cells per condition; n = 4 independent experiments. ns: not significant; *P < 0.05 (Turkey’s multiple comparisons test). (K) Traces of cytosolic Ca2+ in control human fibroblasts, ESYT1–KO fibroblasts, and ESYT1–KO fibroblasts expressing either ESYT1–Myc or an artificial mitochondria–ER tether. All cell lines express the cytosolic fluorescent probe FluoForte. ER-Ca2+ release was stimulated with 10 μM thapsigargin after 10 s of baseline (F/F0; FluoForte). (L) Quantification of the maximal fold change in fluorescence intensity (ΔF/F0) of FluoForte upon thapsigargin stimulation (max F/F0; FluoForte). Mean ± SD, n = 4 independent experiments. ns = not significant (Turkey’s multiple comparisons test). (M) Whole-cell lysates of control human fibroblasts, ESYT1-KO fibroblasts and ESYT1-KO fibroblasts expressing either ESYT1-Myc or an artificial mitochondria–ER tether were analyzed by SDS–PAGE and immunoblotting. Vinculin was used as a loading control. (M, N) Quantification of three independent experiments as in panel (M). The graphs show the signal normalized to vinculin relative to control. Results are expressed as means ± S.D. Two-way ANOVA with a Dunnett correction for multiple comparisons was performed. ns: not significant. (O) Heavy membrane fractions were isolated from control human fibroblasts, ESYT1 knock-out fibroblasts, ESYT1 knock-out fibroblasts expressing ESYT1–Myc or an artificial mitochondria–ER tether, solubilized and analyzed by blue native PAGE. SDHA was used as a loading control.

