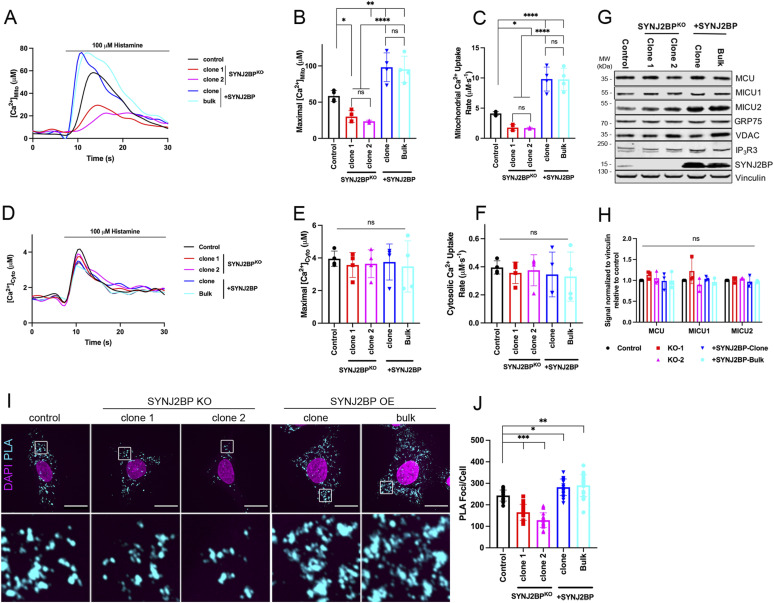
Figure 7. SYNJ2BP is required for ER to mitochondria Ca2+ transfer.
(A) Trace of mitochondrial–aequorin measurements of mitochondrial Ca2+ upon histamine stimulation (100 μM) in control human fibroblasts, SYNJ2BP knock-out fibroblasts (clone 1 and 2), and fibroblasts overexpressing SYNJ2BP (clone and bulk). (B) Quantification of maximal mitochondrial Ca2+. Results are expressed as mean ± SD. From >50 cells per condition; n = 4 independent experiments. ns: not significant; *P < 0.05; **P < 0.01; ****P < 0.0001 (Turkey’s multiple comparisons test). (C) Quantification of the rate of mitochondrial Ca2+ uptake. Results are expressed as mean ± SD. From >50 cells per condition; n = 4 independent experiments. ns: not significant; *P < 0.05; ****P < 0.0001 (Turkey’s multiple comparisons test). (D) Trace of cytosolic–aequorin measurements of cytosolic Ca2+ upon histamine stimulation (100 μM) in control human fibroblasts, SYNJ2BP knock-out fibroblasts (clone 1 and 2), and fibroblasts overexpressing SYNJ2BP (clone and bulk). (E) Quantification of maximal cytosolic Ca2+. Results are expressed as mean ± SD. From >50 cells per condition; n = 4 independent experiments. ns: not significant (Turkey’s multiple comparisons test). (F) Quantification of the rate of cytosolic Ca2+ uptake. Results are expressed as mean ± SD. From >50 cells per condition; n = 4 independent experiments. ns: not significant (Turkey’s multiple comparisons test). (G) Whole-cell lysates of control human fibroblasts, SYNJ2BP knock-out fibroblasts (clone 1 and 2), and fibroblasts overexpressing SYNJ2BP (clone and bulk) were analyzed by SDS–PAGE and immunoblotting. Vinculin was used as a loading control. (G, H) Quantification of three independent experiments as in panel (G). The graphs show the signal normalized to vinculin relative to control. Results are expressed as means ± S.D. Two-way ANOVA with a Dunnett correction for multiple comparisons was performed. ns: not significant. (I) Representative confocal images of PLA experiment in control human fibroblasts, SYNJ2BP knock-out fibroblasts (clone 1 and 2), and fibroblasts overexpressing SYNJ2BP (clone and bulk). Anti-VDAC1 and anti-IP3R1 were used as primary antibodies in the assay. Scale bars represent 20 μm. (H, J) Quantification of average number of PLA foci per cell corresponding to (H). At least 20 cells were quantified per condition per independent experiment, n = 3 independent experiments. Error bars represent mean ± SD. *P < 0.05, **P < 0.01, ***P < 0.001.

